Of Special Interest ...examining a significantly timely topic
Buffered Bulls

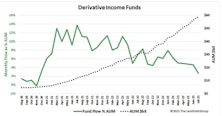
Defined Outcome and Derivative Income ETFs each offer attractive features in the form of modified payout or income characteristics. However, these benefits come at a cost of limited upside, and a “buyer beware” approach should be taken to weighing their pros and cons. Sustained bull markets reveal the true impact of trading potential upside for considerable benefits in the here and now. This study attempts to quantify the opportunity costs of capped funds using 2023-24 as a particularly harsh test case.
Dissecting Factor Performance In 2024

This study provides an initial look at 2024 factor returns, paced by a 25% gain for the S&P 500 index. Three factors topped the S&P (one by just a smidgen) while eight fell short, a ratio we will later see is typical for exuberant bull markets. Of the laggards, six trailed the S&P by more than 10% with a seventh just sneaking inside that ignominious cut point, and their shortfalls contributed to an average factor spread of -6.3% for the eleven contenders. We also find that 2024 was an echo of an even tougher 2023 when the S&Ps 26.3% return was also driven by mega-cap growth, causing nine factors to lag the index with an average shortfall of -9.0%. Two consecutive years with similarly spectacular yet narrow S&P returns led to significant underperformance across our basket of factors and motivated us to try to understand more about this phenomenon.
Collateralized Loan Oxymoron?

A Collateralized Loan Obligation is a special purpose vehicle designed to hold a portfolio of highly leveraged corporate loans in a structure that modifies the risk profile of the underlying loans. A CLO funds its asset purchases by issuing securities backed by the loan portfolio. These liabilities are layered in tranches defined by seniority and credit protection, ranging from AAA to B with a final equity buffer at the base of the capital structure. CLOs have historically been the province of large asset managers, and it is only in recent years that smaller investors have been able to access CLOs simply and easily through an exchange traded fund. Viewing CLO ETFs as a new option in our fixed income toolbox, we felt a deeper investigation was in order.
Tech’s “Pick & Shovel” Disconnect

Information Technology has led the market higher this year, gaining 37% to rank as the leader among all eleven sectors as of November 8th. However, there is a return anomaly within this sector that catches our attention. The S&P 500’s Semiconductor sub-industry has risen 96% while the Semiconductor Equipment sub-industry is up just 9%, miles behind the semiconductor group. The divergence seen in Chart 1 seems hard to fathom given the fundamentally interconnected nature of these two business models.
The Small Cap Slump: Deep Or Wide?

The relative performance of small caps lags the S&P 500 by 75% since 2018, and we wondered why. Was the Magnificent 7 effect so exaggerated that Info Tech and Communication Services, the sectors at the epicenter of the mega-cap growth boom, created such an overwhelmingly high hurdle that small caps were not able to keep pace with these powerhouse companies? Alternatively, has small cap weakness been the product of sluggish results across multiple sectors, irrespective of the mega-cap growth issue, such that large caps were superior no matter which direction you looked? We label these two hypotheses as “deep” (relating specifically to the narrow but intense Mag 7 effect in Info Tech and Comm Services) or “wide” (describing failings across most small cap companies and industries) and designed this study to identify the most likely explanation.
Quality Checked

Traditionally defensive themes such as Staples and Utilities have outperformed over the summer months, reminding investors of the benefit of not going all-in on the AI growth theme. Quality is one of the most robust defensive factors, but even so has managed to outperform during the bull market run that began in October 2022. While some Quality funds are designed to play defense, others seem more inclined to the offensive side of the field. We recommend that investors decide if they are targeting Quality specifically as a defensive exposure or as a core long-term holding to ensure they select the appropriate fund.
“Place Your Bets, Place Your Bets”

With Fed rate cuts likely to begin just days from now, the mathematical connection between changing rates and duration means that lower rates are almost certain to result in higher bond prices, an effect that has proven reliable since 2024’s high point in rates last April. The simple approach of targeting longer durations is complicated by today’s inverted curve, meaning that lower rates will almost surely not manifest themselves through a parallel downward shift in the curve, but will be accompanied by an un-inversion that will return rates to an upward sloping shape. This twist in the curve’s slope will require investors to target the appropriate spot on the curve to optimize the interest rate effect on bond prices.
Styles, Boxes, and Paradoxes

Multi-cap funds face two paradoxes that introduce subtle hurdles into their fund analytics. While it is desirable for a fund to rely on a sound investment process and to follow that process consistently, a successful multi-cap fund might not be able to meet both desires simultaneously. Second, a successful multi-cap fund will always be compared to the highest performing peer group while unsuccessful funds will be compared to a less successful set of peer funds. Attentive fund analysts can overcome the challenges we have identified in this study, assuming they are cognizant of the unique issues facing multi-cap and mid-cap funds. This report is intended to arm analysts with just such insights to ensure that benchmark and peer group comparisons are meaningful and constructive.
Diagnosing Small Caps

After a strong period of market leadership following the internet bubble low of 2002, small cap stocks have been a great disappointment since 2016. Despite favorable economic conditions and a generally bullish market tone since the pandemic, small caps have failed to deliver on the hope of outperformance in a risk-on environment. As tactical investors interested in owning smaller asset classes when conditions are favorable, we are taking a fresh look at small caps, attempting to diagnose what has been ailing this market segment and what might be coming next.
Unlocking Value With “Name & Shame”

The financial performance of Korean companies has retreated to distressingly low levels in recent years. Consider that 67% of KOSPI index members trade at a P/B below 1x, and the median ROE is just 4.9%. To address the concerns of fading corporate performance, low valuations, and weak stock market returns, the Financial Services Commission joined with the Korean Stock Exchange to announce the “Corporate Value-Up” program in February 2024. The objective is to enhance corporate governance and shareholder accountability and to encourage companies to improve financial performance in the areas of P/B, ROE, ROA and shareholder payouts.
Comfort Food

Our March report titled Lifeboat Drill examined the effectiveness of sectors, styles, and factors in protecting investors during major market declines. We found that Consumer Staples are significant and consistent outperformers during times of distress, serving as “comfort food” for investors trying to minimize their financial and emotional distress in a falling market. Staples are relatively inexpensive today based on market-relative metrics, and today’s level of cheapness has historically corresponded to positive relative returns going forward.
Lifeboat Drill
ETFs that focus on a single sector, style, or theme enable investors to make tactical calls that reflect their outlook and risk tolerance, resetting their risk/return profile to benefit from prevailing economic and market conditions. As fate would have it, the explosion of tactical, thematic funds that began 15 years ago coincided with a drought in market cycles. Following the Global Financial Crisis, the S&P 500 only experienced one moderate drawdown in the next nine years, meaning that opportunities to judge these new thematic ETFs during market declines were in short supply. This dearth of real-world corroboration has been remedied in recent years as the market experienced three major declines in the span of 49 months, and this expanded sample size serves as the basis for our current study evaluating defensive ETFs in down markets.
REITs: Worth A Nibble?

Real Estate was the top performing sector in the final quarter of 2023, climbing an impressive 18.8% against the market’s 11.7% gain. Signs of enthusiasm for the REIT industry have been rare in recent times. While the S&P 500 gained 96% over the last five years, REITs returned a paltry 31% over that time. We wondered if last quarter’s success signaled that it was time to take a fresh look at the group. This report examines the investment merits of REITs as an asset class, using the mental model of evaluating “what you pay vs. what you get.”
Fundamentally Magnificent

The Magnificent Seven’s remarkable performance defines the stock market in 2023. This basket of the seven largest companies in the S&P 500 index gained an average of 111% vs. an average gain of 9% for the other 493 companies. The combined impact of huge index weights and outsized performance made 2023 one of the most top-heavy markets in history. Whenever assets outperform to this degree over just a few quarters, the valuation alarm bells start clanging. Could the fundamentals possibly justify such a massive advance, or is AI mania responsible for the outperformance?
Are TLT Investors Early, Or Wrong?

Performance chasing is one of the most common behavioral errors made by mutual fund investors and represents one of the most heavily traveled roads to poor investment results. Now, when we use the phrase performance chasing it is universally understood that we are talking about chasing good performance. That is why we are so intrigued with TLT, this year’s fund flow leader among bond ETFs. The iShares 20+ Year Treasury Bond ETF has raked in over $20 billion in new assets this year, but not by posting strong results. Rather, inflows have surged despite returns that are frankly terrible. Such an incongruity deserves a closer look, and this study lays out some of the key storylines behind this surprising development.
The Case Of The Missing Mo

The momentum style factor has a long history of producing excess returns and is found in the security selection toolbox of many asset managers. This concept is regarded with such esteem that a number of ETFs have been launched to capture this value-added factor, including eight funds with AUM exceeding $300 million. The Magnificent Seven, the seven largest stocks in the S&P 500 index, have booked remarkable returns in 2023 with the equal weighted performance of this basket of tech titans gaining 88% YTD. The also-rans that make up the other 493 members of the S&P 500 have collectively returned a pathetic 1.6%. The Magnificent Seven seem to embody the momentum factor perfectly, yet momentum ETFs have been hugely disappointing this year. Not only have they failed to capture the Magnificent Seven move, but these ETFs have also badly lagged the broader market. This leads to the question, “In a seemingly perfect environment for momentum, what happened to the missing mo?”
Hot Under The Collar
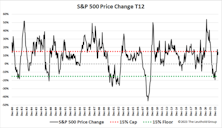
If uncertainty is the bane of investors everywhere, then the fear of large losses in a bear market is the boogeyman hiding in the closet. The threat of an agonizing downturn often leads investors to carry lower equity weights in their balanced portfolios than might be advisable, and even drives them to hold excess cash to avoid the risk of sizable declines.
ETF families have responded to this anxiety with a fund design that takes some downside risk off the table and may enable investors to tiptoe into equities even when they suspect a selloff might be around the corner. Known as “buffer”, “defined outcome”, or “target outcome” funds, these ETFs utilize an options collar overlay to trim the upside and downside tails of the underlying asset’s return distribution, thereby giving nervous investors a more comfortable way to pick up some equity exposure during riskier times.
Reditus Emptor Caveat
Despite skyrocketing investor enthusiasm, buy-write strategies are complicated investments with skewed payoff structures that muddle the interpretation of past performance, because returns depend on market conditions.
Land Of The Rising Stock
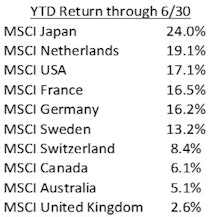
After years of wandering in the wilderness, Japanese stocks are leading the world’s developed markets higher in what has been a robust opening half of the year. The table shows Japan leading the world’s ten largest developed markets (as measured by the MSCI family of international indexes) with a 24% local currency return through June, easily outpacing the pack. Even as the MSCI USA index gained 17% by successfully “fighting the Fed” this year, Japan surged another 7% beyond that outstanding result. We were curious to understand the nature of Japan’s spectacular run in 2023, looking to identify the drivers of this strong and relatively quick jump higher.
Be Contrary On Discretionary

The Fed’s June announcement of a pause with further rate hikes to come has extended the uncertainty of whether an inverted curve and persistent policy tightening will ultimately lead to a recession. The business cycle is a critical investment issue because the relative returns of many assets depend on the state of the macro economy. This study examines the Consumer Discretionary (CD) sector’s behavior in recessionary times, with the goal of understanding the typical performance pattern during economic lows in order to help investors position their portfolios for a potential recession.
Perception for the Professional
May 2026 Issue

Featured Articles
Sector Navigator
May 2026 Issue
