Inside The Stock Market ...trends, cross-currents, and outlook
Who’s Selling Bonds?

Yields on 10-Year U.S. Treasury bonds sunk to an all-time low of 1.37% on July 5th, yet so far there’s been a mysterious absence of contrarians willing to step up to say that “the” secular low in bond yields is at hand.
Discretionary: Is The Top Finally In?
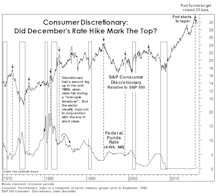
Sector swings have been wild enough thus far in 2016 that Consumer Discretionary’s relative weakness has drawn little commentary.
Recession Watch
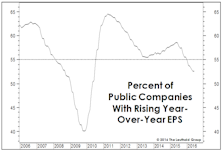
While we don’t see a U.S. recession on a one-year horizon, there are a handful of indicators that may force us to revisit that view—including the two relatively obscure data series shown below.
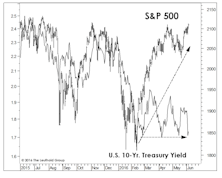
Bond Bubble Spills Into Equities
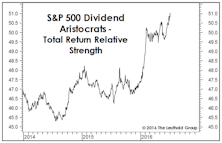
The S&P 500 once again remains on the verge of a new bull market high, thanks in large part to the bubble in another asset class: Bonds.
What’s Past Is Prologue

It was thirty-three years ago today that I began my investment career as an equity analyst at The Bankers Life of Iowa (now known as Principal Financial Group). This month, my first as a gainfully employed member of The Leuthold Group’s research team, it seems natural to reflect back as a preface to my new adventure.
Low Quality Dominance Since March
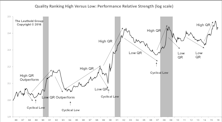
After two rough months moving into 2016, Low Quality stocks rallied and are now leading High Quality stocks YTD. Investors apparently brushed-off the slowdown scare from China, and later the Brexit headlines.
“Index Rebalance Effect” Once Again Proven
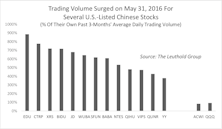
Validating results of a prior study, a look at the last four MSCI index rebalances shows that stocks soon to be added outperform from Announce Date to Effective Date, while deleted stocks underperform.
MSCI Reclassification: Winners & Losers
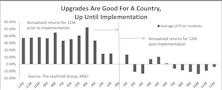
Market classification is an index rebalance on the country level and generally refers to shuffling countries among three baskets: Developed Markets (DM), Emerging Markets (EM) and Frontier Markets (FM).
Rally Extension?
We’ve boosted equity exposure twice in the past several weeks, fully cognizant that it’s not a “textbook” time to do so.
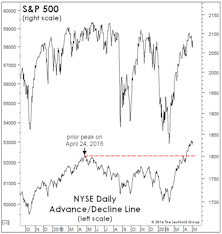
Stock Market Observations
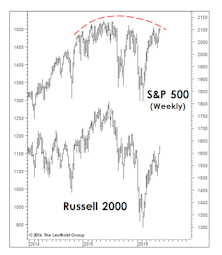
Commentators now label this cyclical advance the “seven-year bull market,” but that won’t be semantically true until the S&P 500 closes above its May 2015 peak of 2130.82.
VLT Says “BUY”
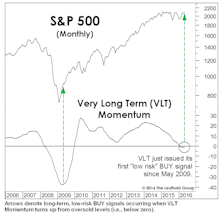
Breadth underlying the 4-month upswing has been stronger than that observed during any other rally leg since 2013. Despite just a 14% correction in the S&P 500 from its peak, a new VLT “BUY” signal was triggered. Failed signals are relatively rare, the last one occurred in December 2001.
Taking Earnings At Face Value
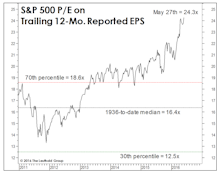
We’ve said before that one of Wall Street’s great inventions is the “forward operating earnings” estimate for the S&P 500, because it results in a P/E ratio that invariably sounds reasonable (if not outright cheap). But this already-misleading EPS metric has become even more so in recent years because of the proliferation of non-GAAP “adjusted EPS” reporting practices.
What Is The Bond Market Telling Us?
We’re tactically bullish, but among the twelve “Charts That Worry Us” published in the April Green Book, we’ll concede there are a few that still worry us.
Apple Falls To Earth
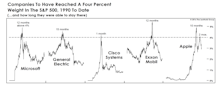
Following a brief re-admittance to the “Four Percent Club,” the value of Apple declined by the equivalent of one General Electric or two IBMs in the span of just over 14 months.
MTI Now Bullish, But Doubts Linger

The Major Trend Index reverted to its bullish zone in the week ended April 15th, following almost ten months in which the work resided in either neutral or negative territory.
Sizing Up The Rally
While our MTI became bullish in mid-April, we can’t rule out that the rebound from February lows could be an impressive bear market rally. However, this rally sports impressive technical credentials.
An Alarming 2008 Analogy?
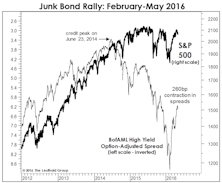
While breadth and leadership accompanying the upswing off February lows have been impressive, the most outstanding feature of this advance might be the confirmation provided by high yield bonds.
“Four On The Floor”
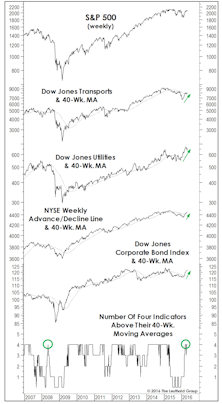
Leadership, breadth, and corporate credit all staged intermediate-term breakouts, rising above their respective 40-week moving averages. In this formation, historically, S&P 500 annualized return is +15%.
Small Caps: The P/E Premium Lives On…

Small Cap valuations may look better on a relative price-to-book basis, but we still believe their Normalized P/E ratios will suffer further compression before Small Caps reclaim the leadership baton.
Xenophobia Gone Too Far?

Donald Trump’s all-but-certain Republican nomination is somehow a fitting capstone to a stock market era in which it’s paid to be provincial.
Perception for the Professional
May 2026 Issue

Featured Articles
Sector Navigator
May 2026 Issue
