Inside The Stock Market ...trends, cross-currents, and outlook
What Are The Transports Telling Us?
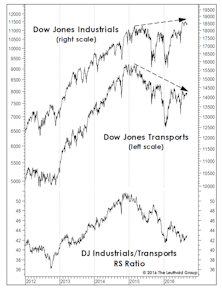
The MTI’s subset of Momentum measures entered September at a 6 1/2-year high reading of +1028, with only two of the category’s 40 inputs in bearish territory.
EM Leadership: Just The Beginning?

Our EM Allocation Model triggered a BUY at the end of August after 5 1/2-years in bear mode. This upgrade is consistent with a cyclical leadership run of one to four years relative to Developed Markets.
EM: The Case For Waiting...
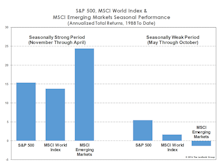
We’ve mentioned that concerns over potential seasonal weakness in September and October seem pronounced this year, perhaps because the year has so far turned out a pleasant surprise following its horrendous start.
Puzzling Trend Of Earnings Release Price Impact

The ER price impact has shifted higher post 2008-2009 financial crisis, and the movement has been more pronounced in the Small Cap universe. A look at analyst coverage and accuracy of estimates.
Long On Equities, Light On Conviction

In the wake of the tech wreck and the housing bust, usage of the term bubble by the media and market pundits has become increasingly liberal.
Bubble Or Not?
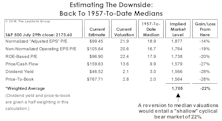
To revisit the all-time valuation peak of March 2000, the S&P 500 would have to reach 3455 (not a forecast!). A reversion to 1957-to-date median valuations implies an S&P 500 loss of 22%. That’s a serious loss, but hardly on the order of a “busted bubble.”
No Sector On Sale...

While cap-weighted U.S. indexes remain far below their 2000 valuation highs, in some ways today’s market presents an even more difficult hurdle for value managers.
Stock Market Breadth: So Good We’re Suspicious
Market breadth measures have been so strong since the February low that we wonder whether something might be wrong with them.
Not Entirely In Sync
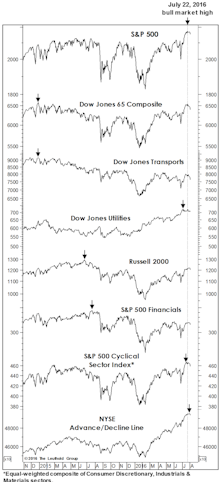
Despite the market’s strong rebound from February lows, four of the seven “Red Flag Indicator” components have failed to confirm the July new-cycle S&P 500 highs.
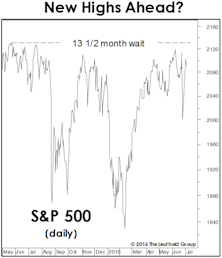
Too Many New Highs To Make A High?
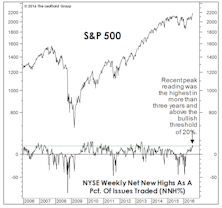
The number of NYSE 52-Week Highs typically peaks during the bull market’s strongest leg, before contracting into the final top. Last month, Net New Highs made a three-year high—implying more upside.
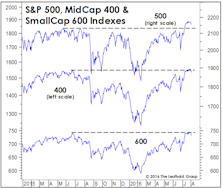
More Upside For Small Caps?

There was a major cyclical BUY signal (VLT Momentum) for the S&P 500 in late-May, and as of July’s close, that bullish development was reinforced by a new VLT BUY signal on the Russell 2000.
Energy: Waiting For The Green Light
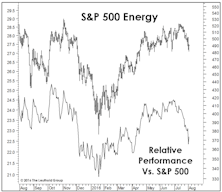
Despite putting in lows in January, the Energy sector has been stuck at the bottom of the GS rankings, and the sector has given up more than half its relative gain over the last several weeks. Perhaps the GS Scores will highlight a better entry point in the months ahead.
Commodities: More To Come?
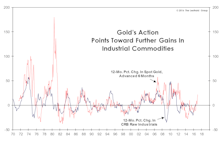
Commodities have enjoyed a strong year thus far, and the GS Scores on the Materials sector have followed suit (albeit with a slight lag), as highlighted in June’s “Of Special Interest” section.
Active vs. Passive: A Three-Club Headwind
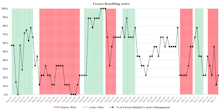
Actively managed funds have recently underperformed passive indexes. As a result, fund inflows and deposits have favored passive funds.
Divergence Among Quality Factors
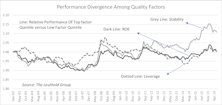
Performance and valuation of the three Quality factors are diverging. From a valuation standpoint, we might see a reversal in performance, with the Stability factor weakening and the Leverage factor strengthening.
From Turkey To Thailand, EM Political Risks Hard To Dodge

A military coup was staged in Turkey on Friday, July 15th, but it was quickly suppressed. The damage, however, was done.
The Policy Conundrum
Over the last eight years, policymakers around the world have held interest rates at unimaginably low levels, run persistently large fiscal deficits, and (in some cases) engaged in outright money-printing via quantitative easing programs.
Stock Market Observations
With the S&P 500 levitating near its all-time high, stock market leadership is peculiar—characterized by a flight to quality. And, despite the market’s violent bounce off February lows, there have been only four new market highs set by key indexes on our “Bull Market Top Timeline” table.
What Are Banks And Bonds Telling Us?
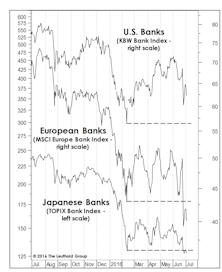
Last month we noted that European and Japanese banks were among the worst-looking industry indexes among the hundreds we monitor—and both groups obliged by dropping 15-20% in the last month.
Low Vol Divergence, Episode 3
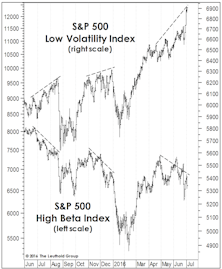
The divergence between S&P 500 Low Volatility and High Beta Indexes has emerged for the 3rd time in a year. The 3-month performance spread is even more extreme than it had been on the eve of either the August or December stock market air pockets.
Perception for the Professional
May 2026 Issue

Featured Articles
Sector Navigator
May 2026 Issue
