Inside The Stock Market ...trends, cross-currents, and outlook
Lo And Behold, Another RATIO!!
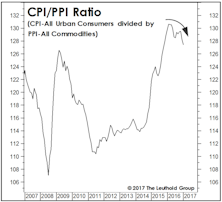
For managers who must remain fully invested in equities (or “paid to play,” as we’ve often called it), the level of inflation might prove a less important consideration than its character.
Emerging Markets: Momentum-Based Sector Rotation

Momentum factors are effective in differentiating EM sector performance, with High Momentum significantly outperforming Low Momentum. Unfortunately, there is a lack of investable EM sector vehicles.
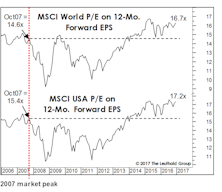
Trump Inherits Poor ‘Initial Conditions’

We think that stocks in Trump’s current term will fall short of Obama’s gains, mostly reflecting a valuation starting point that’s almost twice as high as Obama’s was. “Managing expectations” doesn’t seem like Trump’s style, but in the case of the stock market it might not be a bad idea.
Stock Market Observations
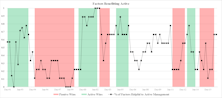
The Major Trend Index stabilized in a moderately bullish range during the past several weeks, yet the Momentum/Breadth/Divergence category is almost the sole carrier of the bullish torch.
“Trailing” EPS Revisited

The S&P 500 trailing P/E has just climbed above 25x—lower than in March 2009—but incredibly high for any period in which earnings weren’t tainted by recession.
Decline Of The Aristocracy

Veteran market analyst Bob Farrell reminds investors that when parabolic uptrends eventually stop, the next move is never sideways. We don’t know that the Dividend Aristocrats and other bond-like stocks traced out a true parabola into last summer’s peaks, but the ugly aftermath suggests they probably did.
What Comes After The Momentum Meltdown?

The sell-off into last February’s low did not qualify as a bear market, but subsequent action—including the mayhem in “factor-land”—certainly suggests it was a very significant “psychological” low.
Active Versus Passive Return Drivers: A Year-End Update
Herein we provide a year-end update on the factors we determined were important to the active/passive relationship. We found that the market environment and the success of active managers changed significantly in late 2016.
How Much Cash Is Stashed Overseas?

Tallying the overseas cash pile, predicting how much may be repatriated, and the potential impact on stock performance are challenging undertakings, which require more art than science.
“Changes In Attitudes, Changes In Latitudes”
The above caption—and Jimmy Buffett song title—comes from the “View From The North Country” section in the first-ever Green Book published in November 1981. Not much has changed in 35 years.
Safety In Numbers?

The S&P 500 closed the first week of January at a new cycle high, up 9.2% from the pre-election low made on November 4th.
Plenty Of Love For The Rally

The less-well-known Stock Market Confidence survey from the Conference Board has poked into “excessively optimistic” territory for the first time since 2003
An Obligatory Rant Over High Valuations
We remain cyclically bullish, but it would be intellectually dishonest to try to make a serious valuation case for the stock market here.
Tilt Toward Beta
Stock market valuations certainly show no lack of investor confidence: each of our “Big Six” valuation measures now resides in either its ninth or tenth historical decile.
Asset Allocation: Buy Strength Or Weakness?

The turn of the calendar seems to bring out the inner contrarian in some investors—those who will peruse last year’s list of lagging asset classes looking for rebound candidates.
Bridesmaid Track Record
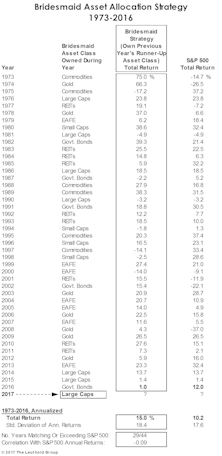
U.S. 10-Year Treasury Bonds—last year’s Bridesmaid holding—eked out a 1% gain in 2016, a disappointing result but one that preserved a streak of positive annual returns dating back to 2001 (Table 2).
Bridesmaid Strategy: Return Vs. Volatility
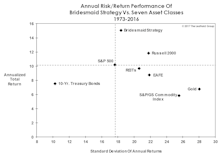
While the consideration of risk seems almost a quaint notion as the bull market nears its eighth birthday, it’s nonetheless worth noting the Bridesmaid allocation strategy has generated a favorable return/volatility trade-off in relation to: (1) the seven candidate asset classes; and, (2) the strategy of owning an asset class with a prior-year total return rank other than #2.
Bridesmaid Strategy For Equity Managers

Our analysis on the Bridesmaid effect originated back in 2006, but was initially based on equity sectors rather than asset classes.
Bridesmaid Sector Track Record
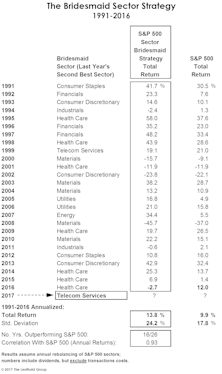
Table 4 shows the annual sector selection and accompanying performance results for the Bridesmaid approach dating back to 1991.
Hate Momentum? Try This...
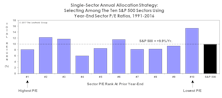
Not wanting to be seen as shameless shills for momentum investing, we’ve developed a contrarian alternative to the Bridesmaid sector approach that’s delivered even better long-term outperformance. It’s based on the holy grail of value investing: Low P/E.
Perception for the Professional
May 2026 Issue

Featured Articles
Sector Navigator
May 2026 Issue
