Inside The Stock Market ...trends, cross-currents, and outlook
Bonds: No Pain, Yet No Gain
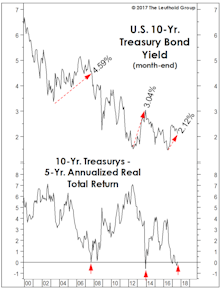
We find it remarkable that the five-year trailing real return on Treasurys has dropped to zero without investors having (yet) suffered any real pain.
Don’t Look Now, But...
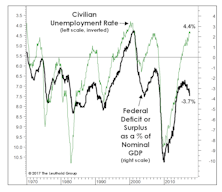
We recognize it’s uncultured to discuss federal debt and deficits during a multi-year bull market, but in economics and investing it frequently pays to worry when others don’t, and to stop worrying when others do.
Momentum-Based Country Rotation: EM Vs. DM
Last month we assessed the effectiveness of using valuation factors as a basis for country allocation. Using 20 years of data, our results showed that they work quite well specifically for Emerging Market (EM) country-rotation, however, the same valuation-based strategy does not appear to be value-added for Developed Market (DM) allocation/rotation.
Cashing In A Few Chips
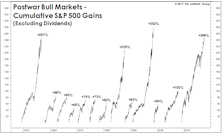
Through early August, the S&P 500 had matched last year’s total return gain of 12%, while futures on that index have gained more than 20% from their after-hours lows made on election night.
Stock Market Observations
The S&P 500 and DJIA were up 10-11% on the year through early August—solid, but not quite the “melt-up” scenario we’d envisioned earlier this year…We think S&P 500 2,550-2,600 will be achieved, but not until year-end…
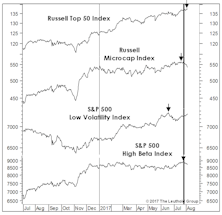
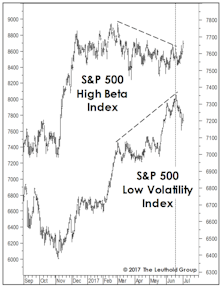
High Beta Breakout?
Last month we spent a full page explaining why the underperformance of the S&P 500 High Beta Index was not a bearish portent for stocks (Chart 1).
Troubling Transports?
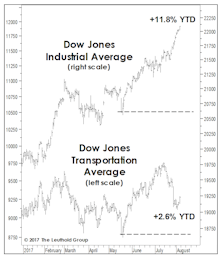
Does the last few weeks’ stumble in the Dow Jones Transportation Average foretell anything sinister? Not on the face of it.
Too Calm For Comfort?

Is stock market volatility so low that it’s a bad thing? For volatility sellers, the answer is an unequivocal yes. But for stock market investors, the answer isn’t so clear.
Time For A ‘Previously Scheduled’ Correction?

The stock market has a tendency to lay an egg during years ending in “7,” specifically during the late summer and fall… ‘Year Seven’ also tends to see a massive volatility spike…
VLT Goes “Quiet”
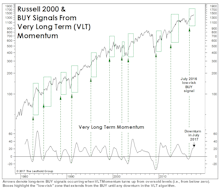
Last year’s “low-risk” BUY signals from our Very Long Term (VLT) Momentum algorithm have proven very profitable, but enough time has elapsed that they should no longer be considered an important bullish factor.
Missing Some Pocket Cash?

Given our money management mantra of “making it and keeping it,” we can’t imagine we’ll ever get comfortable with crypto-currencies.
A Crude Catalyst?

The great mystery behind the trade-weighted dollar’s nearly-10% YTD decline is that it’s failed to fuel further gains (or any gains) in commodity prices in 2017.
Valuation-Based Country Rotation: EM Vs. DM
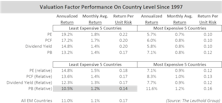
Many studies have evaluated momentum factors for over/underweighting country exposures within a portfolio, but few have considered valuation factors for country rotation within the Emerging Market space.
Special Announcement: James Paulsen, PhD
We are pleased to announce that James Paulsen, PhD, a leading investment strategist whose commentary is widely followed on Wall Street and across the country, has joined The Leuthold Group as our Chief Investment Strategist.
Skies Are Clear, But Travel Not Recommended
Two years ago, we played the role of the bull market’s mortician, preparing it for burial after a six-year run that had taken it to valuations on par with those at the 2007 top.
Stock Market Observations

While the S&P 500 remains below our 2,550-2,600 summer target zone, we can’t help but be impressed by the quality of its recent highs—including confirmations by all of the “Red Flag” bellwethers except the S&P 500 Financials (which barely missed a new high on July 7th).
Today Versus The Tech Bubble Peak

We’ve generally spoken of the market’s “broad participation” as a good thing. And from a purely technical point of view, it is.
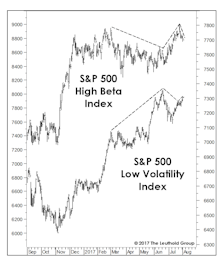
What Does The Low Vol Divergence Mean?
Low Volatility stocks have been the darlings of this bull market, and Low Vol is now considered a long-term “alpha generator” alongside such Hall of Fame quant factors as Low P/E and Price Momentum.
Small Caps Out Of “Phase?”

If one manipulates the data correctly, one can make the size effect—whereby Small Caps earn excess returns over the long pull—look instead like a beta effect.
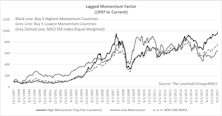
“Mo-Mo” Market Ahead?

After laying an egg in 2016, momentum-based stock selection strategies have acquitted themselves better through the year’s first half.
Perception for the Professional
May 2026 Issue

Featured Articles
Sector Navigator
May 2026 Issue
