Inside The Stock Market ...trends, cross-currents, and outlook
Rates Are Already Clobbering Consumer Stocks
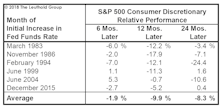
“Three steps and a stumble” was the old rule of thumb for timing the impact of Fed tightening on the stock market.
Time To Get Contrary With Commodities?
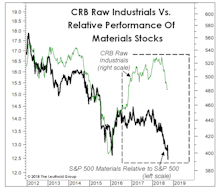
After a strong 2016 and a “Bridesmaid” (i.e., sector runner-up) performance in 2017, the Materials sector seemed primed to benefit from the “late cycle” character of the economy in 2018.
Narrow Performance Divergence Among EM May Not Last
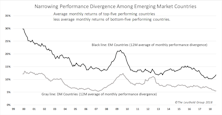
We’ve previously noted the narrowing performance divergence between top- and bottom-performing Emerging Market (EM) countries in recent years.
Beware The Breakout

The S&P 500 finally erased the losses from its nine-day swoon in January and February.
Beware The Policy “Narrative”

It’s been amusing to watch the narrative surrounding Fed policy evolve as the market has rallied.
Breakout Or Fake-Out?
The S&P 500 has fully erased its January and February losses, but there’s probably a market message in the fact that it took so long to do so.
Technical Difficulties
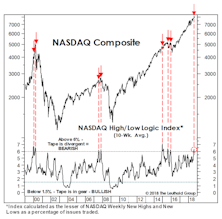
Traditional breadth measures have yet to show end-of-cycle thinning of the ranks, but some secondary measures suggest that process may be underway.
Fondly Remembering The Year 2000...
Many equity investors have suggested there’s no comparison between today’s expensive market and the bubble peak of Y2K, pointing out that today’s Technology titans are “real companies” with massive revenue underpinnings.
The Commodity Bull That Equity Investors Missed...
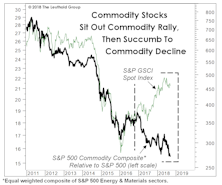
While the bottom-line impact may ultimately be the same, there’s one thing we find more demoralizing than getting the direction of an asset wrong: getting the direction right and not getting paid for it.
Real Rates And The Federal Deficit

We previously mentioned the increasing focus on the real short-term interest rate as an important measure of the Fed’s policy stance. In truth, we wish the Fed had paid more attention to this measure during this cycle.
VLT Turns Up Again??

A “moderate-risk” S&P 500 VLT BUY signal was triggered at the end of August, but it’s not all good news. Any upturn in the VLT while the indicator is in positive territory also sets up a pattern known to veteran market analysts as the “Killer Wave.”
S&P 500—Valuation Check-Up

In late January we speculated how long it would take for the S&P 500’s bloated valuations to reach more reasonable levels. The S&P 500 now trades back where it was in January and the seven-month break included some of the best growth rates most have ever seen. We found ourselves asking: Did chubby Mr. Market shed any pounds as he pedaled away on his stationary bike?
Negative Feedback?
To summarize (and oversimplify), here are some of the frequent client responses to our prevailing “cautiously bearish” stance:
The Flags Are A-Flappin’!

The S&P 500 is on the verge of reversing its early-2018 losses and, if achieved, it would initially be accompanied by six “Red Flags”—which are based on key market indexes failing to record new highs in the 21 trading days preceding a new S&P 500 high. The last time the tally reached “six” was in May 2015—occurring at the final high before an S&P 500 loss of nearly 15% over the ensuing nine months.
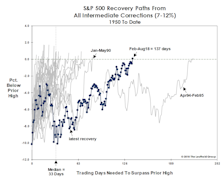
A Launching Pad??
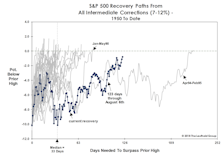
A few clients pointed out that the longest-ever recovery from an intermediate correction (Apr. 1994–Feb. 1995) became the base from which the S&P 500 would eventually triple over the next five years. We’re not equipped to address that possibility in an objective fashion, so we’ll let you be the judge.
Y2K All Over Again?
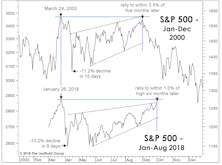
We’ve been reticent to draw links between the current bull and that of the late 1990s; we felt the last phase of the earlier episode was so extraordinary it was unlikely we’d see anything similar again in our lifetimes. But statistical parallels are on the rise, including the attempt by the S&P 500 to recoup its 2018 correction losses.
Assessing The Correction
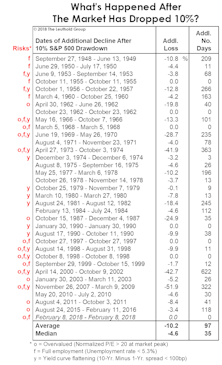
How do today’s cyclical conditions stack up with those accompanying other stock market declines?
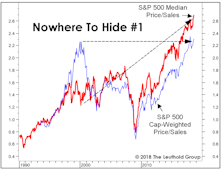
A Market Breadth Mystery
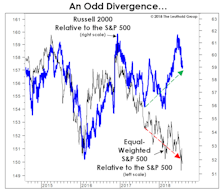
It’s difficult to knock a stock market in which Small Caps and major breadth measures are making frequent new highs, however, there are performance anomalies that suggest liquidity is no longer sufficient to “float all boats.” Recent underperformance of the Equal Weighted S&P 500 is a case in point, at the same time, the current dichotomy in market breadth pales in comparison to the 1999-2000 episode.
Is The Trade War Short-Term Bullish?
We believe the U.S. free-trade initiatives of the last 25 years have been wildly bullish for the stock market.
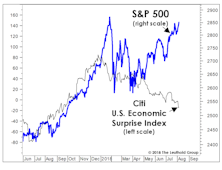
Service Sector Slowdown?
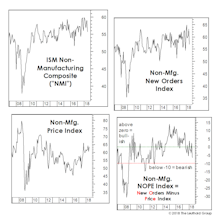
While service industries have minimal direct exposure to trade disputes, they will begin to suffer from knock-on effects if the tensions continue to escalate.
Perception for the Professional
May 2026 Issue

Featured Articles
Sector Navigator
May 2026 Issue
