Inside The Stock Market ...trends, cross-currents, and outlook
Watching For An Internal Washout
Having monitored market internals for warning signs for longer than we care to admit, it’s refreshing to turn around and watch many of the same signals for… wait for it... BUY signals!
You Call That A Panic?
Christmas Eve came not with snowfall but a market freefall which was the worst-ever recorded for that date.
Guess-timating The Downside
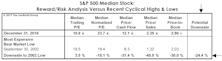
While our market disciplines remain negative, we certainly aren’t oblivious to the haircut in equity valuations that’s already occurred.
“De-Worsification” Ruled In 2018!
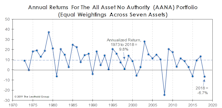
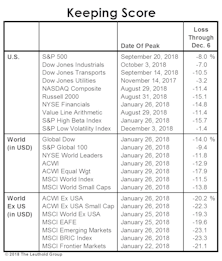
The market difficulties of 2018 were hardly limited to stocks. Commodities, in fact, were the worst performer among the seven major asset classes.
Read This Before Taking The “Plunge”

After a bad market year like 2018, there’s a natural instinct for allocators to skew portfolios toward assets with poor recent performance. History suggests, though, that one shouldn’t make a habit of buying an asset on the basis of price weakness alone.
Bridesmaid Strategy - Asset Classes

The best we can say about last year’s Bridesmaid asset—the S&P 500—is that it did not underperform “the S&P 500.”
Bridesmaid Strategy - Sectors
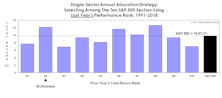
Our analysis of the Bridesmaid effect originated in 2006, but was based on S&P 500 sectors rather than asset classes.
Bridesmaid Strategy - Valuations
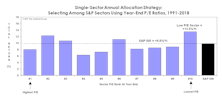
Momentum strategies aren’t for everyone. Still, contrarians should recognize that buying the prior year’s worst performing sector for a one-year hold has been an underperforming proposition over the long term.
Industry Group Dreams And Nightmares

The “Dreams” portfolio represents a simple industry group trend-following approach, while the “Nightmares” portfolio serves as a bottom-fishing strategy made up of the previous year’s biggest losers.
Corporate Executives Might Be Peeking Into Quants’ Toolkits
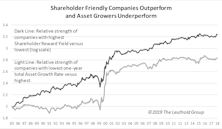
In terms of long-term planning, corporate executives are often tasked with choosing between expanding their business or returning cash as a way to reward shareholders. In the quant world, the two decisions have a consequence on future stock returns.
Bull Pause, Or Bear Paws?
The old maxim says that when the bears have Thanksgiving, the bulls have Christmas.
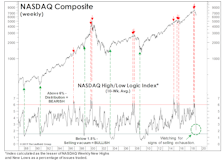
Stock Market Observations
The tops of 1990, 2000, and 2007 were all better “telegraphed” by the action of the market itself, than the September 2018 peak, but secondary measures of market internals suggested all summer that the internal trend was in fact deteriorating—and so did the action in low-grade corporate bonds.
It’s Not A Pause… It’s “Paws”
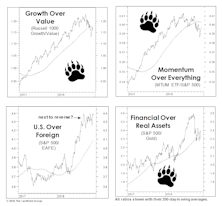
A bear market will almost always prove to be the catalyst of one or more shifts in long-term market leadership.
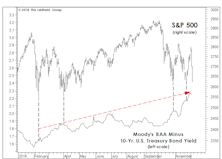
It’s About Money, Not Profits
.png?fit=fillmax&w=222&bg=FFFFFF)
The consensus focus all year has been on the boom in U.S. corporate profits.
Economic Stocking Stuffers
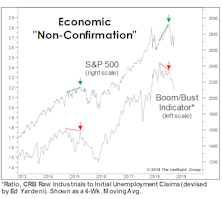
While the monetary and liquidity backdrop has deteriorated all year, the shorter-term economic evidence has remained mixed.
VLT = Very Lousy Timing?

In the spirit of keeping an open mind, three months ago we observed that our S&P 500 VLT Momentum measure had triggered a “moderate-risk” BUY signal with its August reading.
Low Vol For All Seasons?

The S&P 500 Low Volatility Index has performed so well for so long that the ETF based on the index has amassed more than $8 billion.
The Downside Leaders Look Familiar
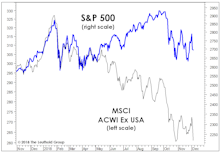
It wouldn’t be a December Green Book without at least one page of hand-wringing over the year’s extreme underperformance of foreign stocks.
Deep-Six The “Threes-Fives”
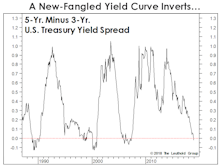
We’ve sometimes called the yield curve our “favorite economist,” so we were amused when some enthusiastic data miner in the Treasury market tried to slip us a cheap imitation in late November.
They Can’t Tax What’s Not Earned

With three quarters of a sharply lower corporate tax rate on the books, the median four-quarter trailing profit margin for both the S&P 500 and S&P MidCap 400 jumped to all-time records in the third quarter.
Perception for the Professional
May 2026 Issue

Featured Articles
Sector Navigator
May 2026 Issue
