Inside The Stock Market ...trends, cross-currents, and outlook
Earnings Releases Cause Surge In Price Volatility

Three years ago, we did a series of studies looking at price reactions to corporate earnings releases (ER) and we found that, since 2007, price movement has become more dramatic on ER days.
Time To Hide In Quality?
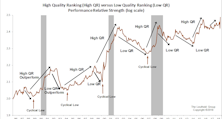
Although both High Quality and Low Quality stocks suffered in the last two months’ market turmoil, we are not surprised to see that, on a relative basis, High Quality stocks outperformed Low Quality.
Warning Crack

We wrote in October’s Green Book that “many once reliable seasonal market patterns have been out of sync in recent years.”
The Rate Hike Carnage Is All Around Us

Taking a cue from the White House, today’s market pundits seem more prone to declarative, unsubstantiated statements than we can ever remember.
BAA Acting Baaaadly!
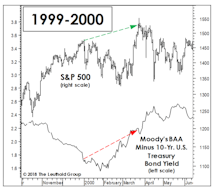
Whether or not they’ve risen for the “right” reasons remains up for debate, but the upward move in interest rates has hit the usual suspects very hard in 2018, like early-cycle industries and Emerging Markets.
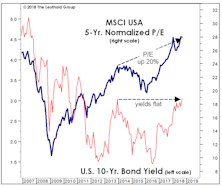
Measuring The Backup In Bond Yields

A couple of months ago, we (belatedly) observed that, in February the 10-year Treasury yield had bro-ken above its 10-year moving average. That simplistic tool has been a pretty good descriptor of yields’ long-term trend for more than a century, with few “whipsaw” signals along the way.
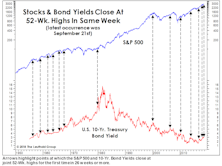
Bond Investors Get It Right Again!

Having devoted all of our professional lives to the monitoring and modeling of equity markets, we’re naturally ticked off that this year’s best stock market signals have in fact been rendered by bonds.
Too Soon To Expect Economic Weakness?
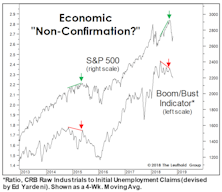
We believe stocks have begun to discount a major inflection point in the economy and corporate profits for 2019 and 2020.
For Asset Allocators, As Bad As It Gets!

During 2018, no major asset class has done well, and in most respects the opportunity-set available this year has been among the worst in the last 50 years.
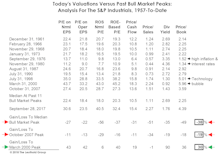
P/E Crash!!
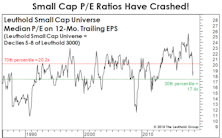
While this year’s liquidity squeeze has yet to exact the toll we ultimately expect on the U.S. stock mar-ket, it has certainly contributed to a sharp compression in P/E multiples.
Emerging Markets: Not Persevering, Just “Preserving”

We’ll never know how world events might have evolved had Mitt Romney won the presidential election in 2012. But thanks to the wonderment of Emerging Markets’ underperformance, we can go right back to the last days preceding that fateful election.
Think Halloween Is Behind Us? Beware, Zombie Alert!
“Zombie” companies are being kept alive by low interest rates and generous credit conditions, and the number of them, worldwide, has risen significantly over the past few years.
Remember Your First SELL?
We’ll never forget the first time we read a SELL recommendation for a stock. It was nearly 30 years ago and we were two weeks into our first job with a small equity management firm.
Stock Market Observations
Throughout the spring and summer, the market could alternatively be characterized as “divergent” or “disjointed”—but until very recently it could not be considered “distributive.” Now, Mid and Small Caps have hit a short-term air pocket and breadth figures were exceptionally poor at September’s scattered highs in the DJIA and S&P 500.
Investor Temperament And The “Tape”
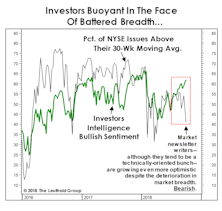
In the first week of October, the share of newsletter bulls topped 61% just as the NYSE percentage slid to 41%. Maybe it’s a seasonal thing… the last time that happened was October 2007.
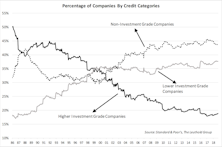
Odds Of Outperforming?

In September, the percentage of S&P 500 stocks outperforming the S&P 500 index fell to 40.7%, the lowest reading since mid-2012. Breadth has followed a conventional path over the course of this unconventional bull market; in the current phase, the odds of outperformance are steadily diminishing.
Seasonality Set To Favor The Bulls
Our bearish stance could be tested by the arrival of the seasonally strongest six-month window of the four-year electoral cycle. Since 1926, November of the mid-term year through April of the pre-election year has produced an average un-annualized S&P 500 +16.4% total return.
Stocks Not Yet Yielding To Yields
Regardless of how it’s measured, the liquidity available for global stocks continues to run off.
Estimating The Downside: The G-Rated Version
The longevity of this bull market is impacting tactical asset allocators in ways great and small.
The Two-Tiered Global Market
We should emphasize that our characterization of stocks as dangerously overvalued applies only to the U.S. market.
Perception for the Professional
May 2026 Issue

Featured Articles
Sector Navigator
May 2026 Issue
