Estimating The Downside

Estimating the Downside - May 2016

The S&P 500 gained 0.3% (price only) in April.
Estimating the Downside - April 2016

The S&P 500 gained 6.6% (price only) in March.
Estimating the Downside - March 2016

The S&P 500 lost 0.4% (price only) in February.
Estimating the Downside - February 2016
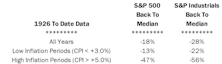
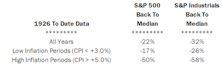
The S&P Industrials’ downside to mean valuation (excludes Utilities and Financials) is 24%, about 3% less than last month’s reading.
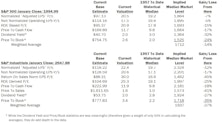
Estimating the Downside - January 2016
The S&P 500 lost 1.8% (price only) in December. Based on the 1957-to-date valuation metrics presented, downside to its historical average decreased by about 2% from last month’s –19% reading.
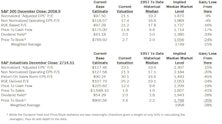
Estimating the Downside - December 2015

The S&P 500 gained 0.1% (price only) in November. Based on the 1957-to-date valuation metrics presented, downside to its historical average increased by about 1% from last month’s –18% reading.
Estimating The Downside - September 2015

The S&P 500 fell 6.3% (price only) in August. Based on the 1957-to-date valuation metrics presented below, downside to its historical average decreased by about 4% from last month’s –19% reading.

Estimating The Downside - May 2015

The S&P 500 gained 0.9% (price only) in April. Based on the 1957-to-date valuation metrics presented below, downside to its historical average widened by about 1% from last month’s –18% reading.
Estimating the Downside - April 2015

The S&P 500 lost 1.7% (price only) in March. Based on the 1957-to-date valuation metrics presented below, downside to its historical average decreased by about 1% from last month’s reading of –19%.
Estimating The Downside - March 2015

The S&P 500 gained 5.5% (price only) in February. Based on the 1957-to-date valuation metrics presented below, downside to its historical average widened by about 5% from the prior month’s reading of –14%.
Estimating The Downside - February 2015
The S&P 500 lost 3.1% (price only) in January. Based on the 1957-to-date valuation metrics presented below, downside to its historical average decreased by about 1% from last month’s reading of –15%.
Estimating The Downside - January 2015
The S&P 500 lost 0.4% (price only) in December. Based on the 1957-to-date valuation metrics presented below, downside to its historical average decreased by about 1% from last month’s reading of –16%.
Estimating The Downside - December 2014

The S&P 500 gained 2.5% (price only) in November.
Estimating The Downside - November 2014

The S&P 500 gained 2.3% (price only) in October. Based on the 1957-to-date valuation metrics presented below, downside to its historical average remains at 14%.
Estimating The Downside - October 2014

The S&P 500 lost 1.6% (price only) in September. Based on the 1957-to-date valuation metrics presented below, downside to its historical average narrowed to 14%, about 2% less than last month’s reading.
Estimating The Downside - September 2014

The S&P 500 gained 3.8% (price only) in August.
Estimating The Downside - August 2014

The S&P 500 lost 1.5% (price only) in July.
Perception for the Professional
May 2026 Issue

Featured Articles
Sector Navigator
May 2026 Issue
