Estimating The Downside
Estimating The Downside - July 2014

The S&P 500 gained 1.9% (price only) in June. Based on the 1957-to-date valuation metrics presented below, downside to its historical average is -14%, about 1% more than last month’s reading. The S&P Industrials’ downside to mean valuation (excludes Utilities and Financials) also increased slightly to -27%.
Estimating The Downside - June 2014

The S&P 500 gained 2.1% (price only) in May. Based on the 1957-to-date valuation metrics presented below, downside to its historical average is -13%, about 1% more than last month’s reading. The S&P Industrials downside to mean valuation (excludes Utilities and Financials) also increased slightly to -26%.
Estimating The Downside - May 2014
The S&P 500 gained 0.6% (price only) in April. Based on the 1957-to-date valuation metrics presented below, downside to its historical average remains at 12%. The S&P Industrials (which excludes Utilities and Financials) is also unchanged at 25% downside to reach mean valuation.
Estimating The Downside - April 2014

The S&P 500 gained 0.7% (price only) in March. Based on the 1957-to-date valuation metrics presented below, the S&P 500 has 12% downside to its historical average. The S&P Industrials (which excludes Utilities and Financials) now has 25% downside to reach mean valuation.
Estimating The Downside - February 2014

The S&P 500 lost 3.6% (price only) in January. Based on the valuation metrics presented below, the S&P 500 has 10% downside to its historical average. The S&P Industrials (which excludes Utilities and Financials) now has 23% downside to reach mean valuation.
Estimating The Downside - January 2014

The S&P 500 gained 2.4% (price only) in December. Based on the valuation metrics presented below, the S&P 500 has 15% downside to its historical average. The S&P Industrials (excludes Utilities and Financials) now has 26% downside to reach mean valuation.
Estimating The Downside - December 2013

The S&P 500 gained 2.8% (price only) in November. Based on the valuation metrics presented below, the S&P 500 has 14% downside to its historical average.
Estimating The Downside - November 2013

The S&P 500 gained 4.5% (price only) in October. Based on the valuation metrics presented below, the S&P 500 has 12% downside to reach its historical average.
Estimating Downside - October 2013
The S&P 500 gained 3.0% (price only) in September. Based on the valuation metrics presented in the table below, the S&P 500 has 9% downside to reach its historical average. The S&P Industrials (excludes Utilities and Financials) now has 22% downside to reach mean valuation.
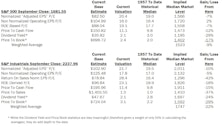
Estimating The Downside - September 2013
The S&P 500 lost 3.1% (price only) in August. Based on the valuation metrics presented in the table below, the S&P 500 is 8% above its historical average. The S&P Industrials (excludes Utilities and Financials) now has 20% downside to reach mean valuation.
Estimating The Downside - August 2013
The S&P 500 gained 4.9% (price only) in July. Based on the valuation metrics presented in the table below, the S&P 500 is 12% above its historical average. S&P Industrials (excludes Utilities and Financials) now have 21% downside to reach mean valuation.
Perception for the Professional
May 2026 Issue

Featured Articles
Sector Navigator
May 2026 Issue
