Estimating The Downside
Estimating the Downside - February 2018

This multi-factor estimate of stock market risk is based on a regression to median stock market levels.
Estimating the Downside - January 2018

This multi-factor estimate of stock market risk is based on a regression to median stock market levels.
Estimating the Downside - December 2017

This multi-factor estimate of stock market risk is based on a regression to median stock market levels.
Estimating the Downside - November 2017

This multi-factor estimate of stock market risk is based on a regression to median stock market levels.
Estimating the Downside - October 2017

This multi-factor estimate of stock market risk is based on a regression to median stock market levels. The valuation comparisons in the detailed tables consider all inflation periods since 1957.
Estimating the Downside - September 2017

This multi-factor estimate of stock market risk is based on a regression to median stock market levels.
Estimating the Downside - August 2017

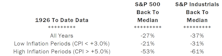
Based on 1957-to-date valuation metrics, the S&P 500 potential downside to median levels is -25%. Secular bear markets, however, fall well below median levels; based on a decline to the 25th percentile of 1957-to-date distributions, the S&P 500 would have to fall 36% to 1,591 (not a prediction).
Estimating the Downside - July 2017

This multi-factor estimate of stock market risk is based on a regression to median stock market levels.
Estimating the Downside - June 2017

This multi-factor estimate of stock market risk is based on a regression to median stock market levels.
Estimating the Downside - May 2017

This multi-factor estimate of stock market risk is based on a regression to median stock market levels.
Estimating the Downside - April 2017

This multi-factor estimate of stock market risk is based on a regression to median stock market levels.
Estimating the Downside - March 2017

This multi-factor estimate of stock market risk is based on a regression to median stock market levels.
Estimating the Downside - February 2017
The S&P 500 gained 1.9% in January. Based on the 1957-to-date valuation metrics presented, the potential downside compared to its historical average remained the same as last month’s reading (-21%).
Estimating the Downside - January 2017

The S&P 500 gained 1.98% in December. Based on the 1957-to-date valuation metrics presented, the potential downside compared to its historical average widened by 1% from last month’s –20% reading.
Estimating the Downside - December 2016

The S&P 500 gained 3.70% in November. Based on the 1957-to-date valuation metrics presented, the potential downside to its historical average widened by 1% from last month’s –19% reading.

Estimating the Downside - October 2016

The S&P 500 gained 0.02% in September. Based on the 1957-to-date valuation metrics presented, downside to its historical average narrowed by about 1% from last month’s –21% reading.
Estimating the Downside - September 2016

The S&P 500 gained 0.1% in August. Based on the 1957-to-date valuation metrics presented, downside to its historical average narrowed by about 1% from last month’s –22% reading.
Estimating the Downside - August 2016

The S&P 500 gained 3.7% in July. Based on the 1957-to-date valuation metrics presented, downside to its historical average widened by about 3% from last month’s –19% reading.
Estimating the Downside - July 2016
Back to the medians (1957 to date): S&P 500 19% downside.
Perception for the Professional
May 2026 Issue

Featured Articles
Sector Navigator
May 2026 Issue
