Valuations
A “Litmus Group” For The Bulls

As troubled sectors vary from downturn to downturn, commercial banks have shown an uncanny ability to leap in front of each cycle’s proverbial pie truck. This time, it’s hard to identify the precise epicenter—especially amidst all the bailouts.
A “Low-Risk” BUY?!?
So what do we make of July’s “low-risk” VLT BUY signal on the DJIA—the index on which the indicator’s creator (Sedge Coppock) did his original work? Sadly, not much.
Implications Of The “Breakout”

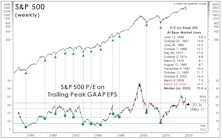
July’s developments led to us investigate the market valuations accompanying all past month-end S&P 500 breakouts which (1) eclipsed the prior month-end bull market high; and (2) made a new all-time high in the process.
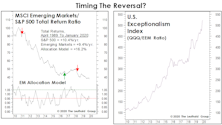
The Growth Style’s Twin Peaks
_0.jpg?fit=fillmax&w=222&bg=FFFFFF)
The strong market rebound in the second quarter lifted the relative return of Growth vs. Value to an all-time high by the end of June. Chart 1 reveals that the cumulative S&P 500 Growth / Value return spread hit a new record last month, surpassing the previous high reached at the end of the Tech bubble in June 2000.
The Wrong Kind Of “Head Start”
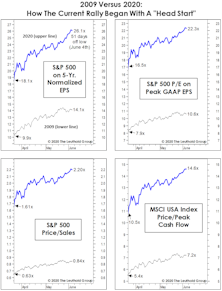
The rally’s initial resemblance to the first up-leg off the secular 2009 market bottom is remarkable. Both rallies started in March, and achieved gains of almost 40% within 50 trading days. Both, of course, sprung from a backdrop of unprecedented monetary stimulus.
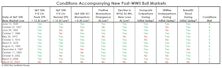
“Not Quite” Super

The average “super-overbought” MBI reading occurred 54 days after a market low; June 4th marks the 51st trading day since the March 23rd low. Thus, any signal in the days ahead would arrive essentially “on time,” but the slippage (the S&P 500 gain already realized) would be enormous at around 40%!
Small Cap Valuations: Zombies And Ragamuffins

Asset allocation decisions are fairly straightforward for groups of profitable and growing companies that fit nicely into a discounted cash flow model, but it is more difficult to describe the valuation of groups that include unprofitable companies.
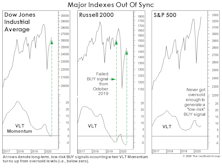
Can The Rally Recover From Its 0-For-8 Start?
The current rally is either the first upleg of a new bull market, or the second-largest bear market rally in the last 125 years. The lone development that can settle the issue is for the S&P 500 to move above its February 19th closing high of 3,386.15.
Calculate The Next Low... With The Last Peak?
How does one value a stock market in which 12-month forward EPS estimates show their widest dispersion in history? A good start might be with methods we use when forward estimates show practically no dispersion (like three months ago). In either case, we place little weight on such estimates; each revision usually has only marginal impact on our 5-Year Normalized EPS.
There’s More To It Than That

It’s a down year for stocks, yet John Bogle must still be chuckling. A full-employment economy that had propped up one of the two most overvalued stock markets in U.S. history just suffered a cataclysmic “sudden stop.” Yet Bogle’s buy-and-hold disciplines have so far dodged the bear.
Are Foreign Stocks Cheap Enough?
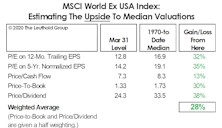
For those who must remain fully invested, an interesting (if not sickening) feature of the bear market is that those who entered it loaded with the most expensive and “trendiest” stocks and sectors have lost the least.
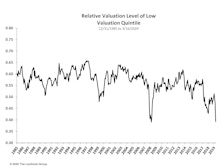
Are SMIDs Cheap Enough?
A composite measure of Mid Caps and Small Caps are at bottom-decile valuations relative to their 26-year histories. From a shorter-term viewpoint, though, we find it scary that valuations are so low just a single month into the recession.
A Bear Market In Price, But Not Time
We have a hard time accepting that the excesses associated with an eleven-year bull market and expansion can be fully expunged in 27 trading days, no matter how ugly those days were… keep some powder dry!
Remembering Another “March Milestone”
.jpg?fit=fillmax&w=222&bg=FFFFFF)
While the bull didn’t live to see his 11th birthday, this month did mark the anniversary of another historic event: Twenty years ago this week saw the peak bubble-era close in the S&P 500 of 1,527.46.
Valuations: A “Progress” Report
.jpg?fit=fillmax&w=222&bg=FFFFFF)
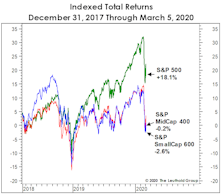
As deep as the losses in the DJIA and S&P 500 have been, most professional investors recognize that those averages have masked the extent of the damage suffered by most stocks.
Valuation Dispersions Reach 2009 Levels
The recent market turmoil has only served to exacerbate equity style trends that have been in place for years, with Value, Small Caps, and High Beta all underperforming relative to Growth / Momentum, Large Cap, and Low Volatility, respectively.
Estimating The Downside

With the markets in freefall, we’ve seen a dramatic spike in interest in our monthly “Estimating the Downside” vignette. We think a mid-month snapshot is in order to give some idea as to how much meat has been taken off the valuation bone.
A Developing Opportunity In The “SMIDs?”
The underperformance of Mid and Small Caps in the last few years has taken valuations from top-decile readings (and, indeed, a few all-time records) just 25 months ago, down to the middle—and even lower reaches—of their 30-year valuation boundaries.
Interim Memo
The coronavirus epidemic/pandemic is getting the bulk of the blame for the sudden collapse in U.S. equities, and certainly qualifies as one of the few “black swans” seen in modern market history. We do not think the ultimate path of the coronavirus contagion can be analyzed at this point, and medical experts foresee possible outcomes ranging from a serious epidemic to a short burst of illness that fades with the summer weather.
EM Equity Purgatory
Nine months ago we established a “pilot” position of 4% in Emerging Market equities in the Leuthold Core Fund, based mostly on the bullish inflection in a long-term technical indicator (VLT Momentum).
Perception for the Professional
March 2026 Issue

Featured Articles
Sector Navigator
March 2026 Issue
