Earnings
S&P 500 Earnings Waterfall 2Q 2023
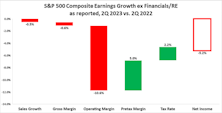
This month’s Refresh continues our practice of summarizing the latest earnings season by evaluating the composite results of the S&P 500 member companies. Many analysts address sales and net income, but rarely speak to the middle lines of the income statement.
Excellent Back 9 For Q2 Reporting
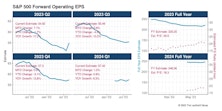
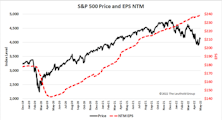
An outstanding second half for Q2-23 earnings pushed the S&P 500 bottom-up EPS estimate from $51.30 to $54.92. Amazon and Nvidia were the two largest contributors to the August surge. With the entire index nearly done reporting, our current EPS estimate will end 11% below its high watermark ($61.56).
Q2—The EPS Slide Resumes
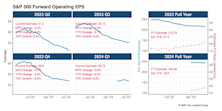
Q2-23 reporting is about halfway complete for firms in the S&P 500. Bottom-up operating EPS estimates for Q2 are once again sliding lower as we wade farther into earnings season. This attrition is not uncommon but it is certainly a break from Q1 announcements, where EPS estimates rose 5% over the course of reporting. Q1’s action was a bullish talking point for many who touted the end of higher-than-normal erosion in forward EPS estimates over the past year. Since peaking in April 2022 at $61.56, Q2’s EPS estimate has shrunk nearly 17% (Chart 1).
Marg-flation
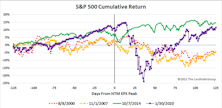
The 2022 bear market will be remembered as a year when collapsing growth stock valuations and rising interest rates doomed almost every asset class to return purgatory. Hopes for avoiding a second down year rest with a potential top in interest rates and solid earnings underpinning the stock market. Wall Street strategists have a year-end 2023 price target of just over 4,000 for the S&P 500, a few percentage points of upside from today but hardly reason to toast a prosperous new year.
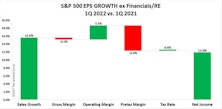
Third Quarter 2022 Earnings Waterfall

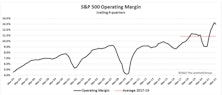
This earnings season has not been free of concern, and profit margins are clearly weakening from last year’s highs. Our earnings waterfall template highlights several themes coming out of third quarter results.
Earnings Expectations: The Bear’s Other Shoe
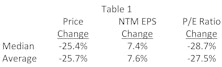
To paraphrase that great market historian Leo Tolstoy, “each bear market is unhappy in its own way.” Recession, interest rates, valuation bubbles, inflation, war, credit cycles, oil prices, manias & panics: the tipping point that triggers each bear market is always different. However, bearish forces ultimately manifest themselves in just two ways; declining earnings and/or declining valuations. June’s Of Special Interest report detailed how the current bear market has been fueled entirely by collapsing valuations, with the largest P/E compressions occurring in companies with the highest starting valuations.
Margin Pressure Under The Surface?
The spectacular economic rebound from the pandemic lockdown lifted corporate earnings to heights that are almost hard to fathom. That stupendous earnings run has been fueled by rising profit margins, which also reached record highs after the pandemic.
Research Preview: The Impact Of Falling Estimates
The 2022 bear market has been driven entirely by a collapse in P/E ratios. Last month, we noted that the other potential driver of market declines—falling earnings—had yet to raise its ugly head. Now we examine past episodes to consider how the stock market might react when the “other shoe” (EPS) drops.
“PSsss”
The most brutal bear markets occur when falling earnings are accompanied by shrinking valuations, producing a compound negative effect on stock prices. Investors in 2022 have (so far) avoided this double-whammy in that valuations have taken a hit, but EPS estimates are holding strong. We are intrigued by the notion that 2022’s bear market has, to date, been all about valuation compression rather than earnings weakness. Investors are coping with the problems of the day by letting the air out of bubbly valuations, and this report takes a closer look at the valuation squeeze underlying the current selloff.
Research Preview: P/E Multiple Compression In 2022
Stock market corrections are the result of falling valuations and/or falling earnings, and when both conditions appear together, investors are in for a rough ride. Thus far, the 2022 selloff has been confined to compressing P/E ratios, and we launched a research project to take a closer look at shrinking stock valuations in this market downdraft.
Earnings: Reversing The “New Normal?”
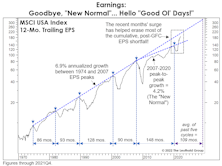
If earnings’ nearly vertical ascent continues for another six months, 12-month trailing EPS will intersect the 6.9% long-term-growth trend line connecting the five major EPS peaks between 1974 and 2007. The “New Normal” has given way to the “Good Ol’ Days!”
Hello To The Roaring Thirties?!
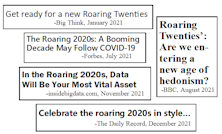
The ink hadn’t dried on 2020’s PPP checks when pundits began speculating that the new decade could be a repeat of last century’s “Roaring Twenties.” That’s become a popular view after a booming 5.7% real GDP growth and a nearly 30% stock market gain in 2021. Just how popular? Analysts are already extrapolating their bullish views into the 2030s!
2022 Earnings: Place Your Bets

It’s once again that time of year for what our founder deemed the great “thermal pollution.” Market pundits and prognosticators will divine, guess, and predict all that the market will bring in the new year.
Valuations And The Earnings Recovery
Analysts at Standard & Poor’s will soon confirm what’s been known for several months: The earnings downturn associated with the COVID recession was the shallowest and shortest of any recession-related EPS decline.
The EPS Recovery And "The Cycle"
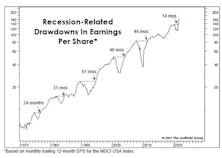
In a couple of weeks, final second quarter EPS for the S&P 500 will confirm the fastest recovery ever from a recession-related earnings decline. That’s old news, and before it has even hit the tape. But we’ve had a sneak peak from the monthly, 12-month trailing EPS numbers published by MSCI for its USA Large Cap Index. Those figures showed that EPS exceeded their pre-COVID peak in May, and the latest reading (through August) is already 22% above the prior high! Simple trendline analysis suggests that EPS for U.S. Large Caps are likely higher today than they would have been in the absence of the COVID pandemic and hyper-stimulative response.
The 2021 EPS Rocket Ship
.jpg?fit=fillmax&w=222&bg=FFFFFF)
If you want to see a rocket ship, there’s no need to crane your neck upwards to see the latest exploits of our billionaire space cowboys. Rather, look to our earnings glidepath chart and marvel at the contrails of the 2021 full year operating earnings for the S&P 500.
Peak Earnings Yield A Rock-Bottom Forecast
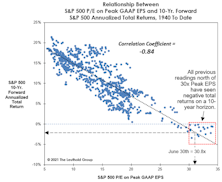
At today’s 30.8x, the Peak P/E stands in the 99th percentile on all time horizons except the “New Era” (1995-to-date). Yet, that’s still five “handles” below the 35.8x all-time high recorded in December 1999. If that figure is matched, the S&P 500 will top 5,000.
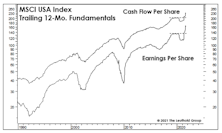
The Earnings Recession Is History
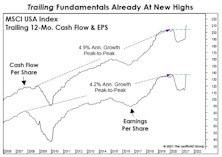
We expected that the earnings recovery from the shortest-ever U.S. recession would be the fastest on record. Trailing figures for the MSCI USA Index now confirm this: Trailing EPS and Cash Flow Per Share have surged to new highs only 14 months after their March 2020 peaks.
“Surprise” Or “No Surprise?”
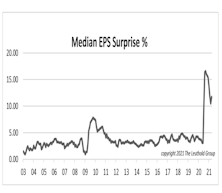
Navigating the investment landscape over the past year has been a journey full of surprises. No data other than “earnings surprises” can better demonstrate how unpredictable companies’ financial performance has become.
Valuing The Experiential Reopening
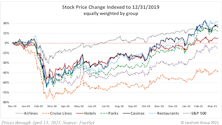
The onset of the COVID-19 pandemic in early 2020 brought a sudden halt to social gatherings, crowd events, and even personal contacts. Experiential business models were hardest hit by forced closures and lockdowns; cruise ships were forbidden to sail, restaurants and theme parks were closed, and air travel and hotel occupancy dwindled, all in an attempt to minimize personal interactions. The stocks of leisure services companies took a beating in March 2020, with Chart 1 documenting the virus’ impact on 34 large and midcap stocks representing this theme.
Perception for the Professional
March 2026 Issue

Featured Articles
Sector Navigator
March 2026 Issue
