Earnings
Earnings Momentum

Initial Q1 Earnings Well Below Average.
Earnings Momentum

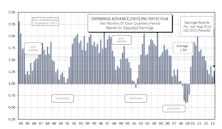
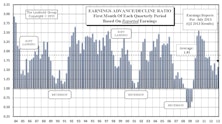
“Three Month” Up/Down Earnings Ratio Ends Q4 With a Whimper.
Earnings Momentum

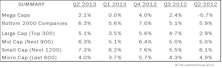
Up/Down Earnings: Q4 Results Just Below Historical Average. Median Q4 YOY Revenue Comparisons: Strength In Large Caps. Q4 Median Company Earnings Growth: Initial Results Are Impressive
Earnings Momentum

Up/Down Earnings: Q3 Ends Below Average. Median Q3 YOY Revenue Comparisons: Small And Mid Caps Continue Leading. Q3 Median Company Earnings Growth: Mid Caps Continue Leading
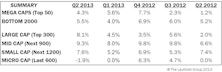
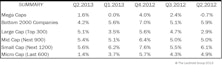
Small/Mid/Large Cap Internals
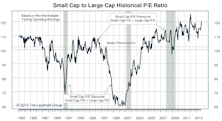
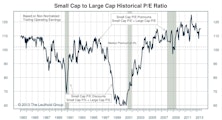
Small Caps are selling at a 20% valuation premium relative to Large Caps, using non-normalized trailing operating earnings.
Earning Momentum
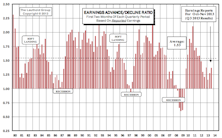
While the current ratio of 1.37 is relatively weak historically, it is still an improvement from the second months’ readings of Q2 (1.27) and Q1 (1.16).
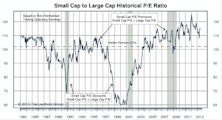
Small Cap Premium Ticks Up To 16%
Small Caps are selling at a 16% valuation premium relative to Large Caps, using non-normalized trailing operating earnings. Using estimated operating earnings, Small Caps are selling at a higher valuation premium of 23% (25% last month).
Up/Down Earnings: Q3 First Month Results Close To Historical Average

The first month of Q3 earnings came in with an Up/Down reading of 1.73, just below the historical average of 1.81 but ahead of the first months’ readings for Q2 (1.59) and Q1 (1.38).
Earnings Momentum - Q2 Reports Below Average But Ahead Of Q1

With all three months of Q2 earnings reports in, the 1.28 ratio is much stronger than Q1, but remains below the 1.51 historical average ratio.
Small Cap Premium Remains 15%
Small Caps are selling at a 15% valuation premium relative to Large Caps, using non-normalized trailing operating earnings. This is the same as the past two months’ readings. Using estimated 2013 operating earnings, Small Caps are selling at a higher valuation premium of 23% (24% last month).
Q2 Median Company Earnings Growth Rates Vary Drastically Across Cap Size
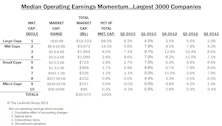
EPS growth for Large and Mid Cap companies continues exceeding their top-line growth, but Small and Micro Cap companies saw their EPS growth rates coming in below their top-line growth rates.
Q2 Median Revenue Comparisons: Higher Growth Across All Segments
Large Cap result this month is the same as last month, but remains stronger than Q1. Smaller firms reversed course, as Mid, Small, and Micro Caps all rebounded with large sales momentum increases.
Up/Down Earnings Ratio: Q2 Reports Below Average But Ahead Of Q1
With two months of Q2 earnings reports in, results have continued trending downward with a reading of 1.27.
Small Cap Premium Remains 15%
Small Caps are selling at a 15% valuation premium relative to Large Caps, using non-normalized trailing operating earnings. This is the same as last month’s reading. Using estimated 2013 operating earnings, Small Caps are selling at a higher valuation premium of 24% (25% last month).
Q2 Median Revenue Comparisons: Higher Growth In Large And Mid Caps
Q2 relative to Q1 growth rates have improved for larger cap companies but deteriorated for the smaller firms.
Up/Down Earnings: Q2 Reports Start Below Average But Ahead Of Q1
The first month of Q2 reports looks better than feared with a reading of 1.59. This is below the average of 1.81, but given this earnings season’s low expectations, investors should breathe a sigh of relief.
MTI Slips To Neutral… Now What?

While we don’t know which direction it will head next, we break down a few of the MTI categories and present some of our observations.
Momentum Drive Returns; Correlations Increase

The worst performers are the first sell candidates for investors looking to shed assets.
Global Perspective On 2012 Earnings, Sales, and Margins
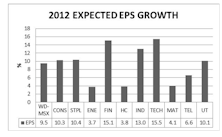
Leuthold’s Eric Weigel dissects earnings, sales and margin expectations for the coming year.
Perception for the Professional
March 2026 Issue

Featured Articles
Sector Navigator
March 2026 Issue
