Breadth
Yelling “Fire” In A Crowded Theater?

The latest market down-leg triggered one of our short-term breadth oscillators into super-oversold territory. While “oversold” may sound bullish to most contrarians, when SPX becomes as internally weak on a 10-day basis as it did in early October, there’s usually another shoe to drop.
Breadth Catch-Up!
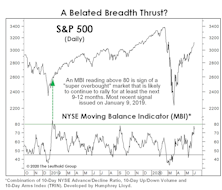
The market broadened enough in July for the NYSE Daily A/D Line to “confirm” new SPX highs—a statistical positive: When the A/D Line made a concurrent 12-month high during July, the average return for August-December was +6.5% versus -1.1% when breadth didn’t confirm the index.
Neutral (But Leaning Negative)
U.S. stocks have either begun one of the most underwhelming and economically illogical bull markets in history, or have staged an exceptionally long and deceptive bear market rally. Our bet is on the latter.
Market Odds For The Second Half
.jpg?fit=fillmax&w=222&bg=FFFFFF)
With the halfway point of 2023 two weeks away, the S&P 500 has broken out to a 12-month high. The index has accomplished that feat 32 times during the month of June—or exactly one-third of all cases measured back to 1928.
Sliced Breadth
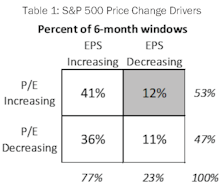
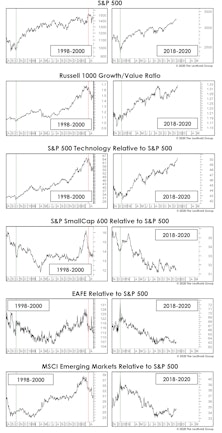
The S&P 500 posted a 7.7% price gain for the six months ended April 30th, although this advance has been a hard-fought battle as gains have resulted from a narrow list of drivers. Style leadership has been concentrated in mega-cap tech names, such that the ten members of the NYSE FANG+® Index have produced 77% of the S&P 500’s YTD gain. Furthermore, gains over recent months have resulted solely from expanding multiples. Narrowness in either thematic leadership or price drivers is concerning because breadth is a useful concept in evaluating the staying power of a market advance. In light of this year’s market action, we are intrigued by the notion of measuring breadth not simply by price moves alone but by examining each of these two important sub-components individually. Does today’s environment, where price gains are driven by valuation increases alone, tell us anything about future market returns?
Research Preview: Market Narrowness In 2023

The S&P 500 posted an encouraging +9.2% YTD, but below the surface that strong return was the result of a limited number of influences. There is narrowness in both thematic and return drivers; the fact that gains have not been broad-based is cause for concern about performance during the remainder of 2023.
“Toro Nuevo” Or Mirage?
While our breadth measures do not consider this rally to be thrust-worthy, when based on nothing more than performance, it’s difficult to distinguish between the “first up-leg” in a new bull market and a bear-market rally. The vital signs at present appear to be more in-line with the latter (although making that conclusion based on price action, alone, is hardly better than a coin toss).
Nothing Close To A “Thrust”

Many technicians claim that the rallies of late March and late May generated impressive “breadth thrusts.” We’re skeptical: We’ve tested many tools that attempt to capture such a phenomenon, and found that the most reliable thrust signals aren’t ones that show up every couple of months.
Not Dot-Com
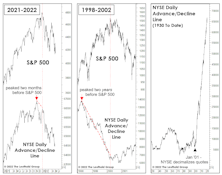
Bulls have been quick to assure us that this market “bears” no resemblance to the dot-com bust. We agree—but probably for very different reasons. Among them are the conventional breadth measures, which provided little warning of this year’s January peak. And, the initial decline off January’s top has been much broader than during the first phase of the dot-com bust.
Limping Into Wildcard Weekend With A Compound Fracture
.jpg?fit=fillmax&w=222&bg=FFFFFF)
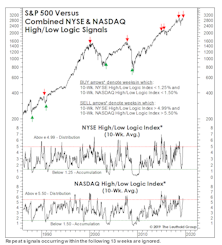
We wrote in the latest Green Book that a breadth indicator that should be more well-known than it is—the High/Low Logic Index (or HLLI)—had moved to “maximum negative” right at the cycle high in the NASDAQ Composite on November 19th. Specifically, the 10-week moving average of this indicator showed a perilous internal condition in which too many NASDAQ stocks were reaching 52-week New Highs and New Lows simultaneously. That’s the very definition of a “fractured” market, and has preceded some important NASDAQ declines. There have also been a couple of premature warnings, as in the summers of 1996 and 2019.
NASDAQ Natterings
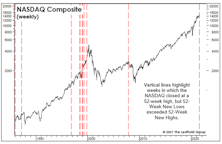
In the week ended July 23rd, the NASDAQ accomplished a rare feat by closing at a 52-week high at the same time that more of its members were pegging 52-week New Lows than New Highs. That last occurred at the exact NASDAQ high preceding the GFC collapse; there was also a timely warning ahead of the crash of 1987.
The “Tape” Doesn’t Always “Tell All”
Technicians are collectively bullish because of the absence of any serious internal divergences. But, severe corrections can erupt with little, or no advance warning from a deterioration in breadth and leadership. In fact, the first few years of the last bull market provided two such examples (mid-2010 and mid-2011).
Revenge Of The Nerds?
Last month we detailed two technical shortcomings of the rally off the March 23rd market low. The stock market duly noted our critique and has issued its response.
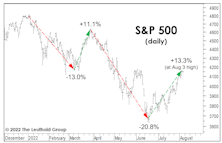
Can The Rally Recover From Its 0-For-8 Start?
The current rally is either the first upleg of a new bull market, or the second-largest bear market rally in the last 125 years. The lone development that can settle the issue is for the S&P 500 to move above its February 19th closing high of 3,386.15.
A Bounce Without “Oomph”
One would think that one of the most explosive market rallies of all time would trip-off all the traditional “breadth thrust” signals, or maybe even invent a few of its own. Sorry, no luck.
This Bounce Lacks “Oomph”
.jpg?fit=fillmax&w=222&bg=FFFFFF)
Through last night’s close, the S&P 500 had gained 25.0% in exactly one month. Impressive, but a bit superficial. Anyone running active equity portfolios recognizes the breadth of this move has been unusually narrow.
Let’s Concentrate For A Moment
.jpg?fit=fillmax&w=222&bg=FFFFFF)
In the immortal words of Lloyd Bridges, “Looks like I picked the wrong week to quit drinking.” Let’s put aside this week’s market turmoil and concentrate for a moment on... “concentration.” Market concentration, that is. Close your eyes and think back to those carefree days of mid-February.
Closing The Books On Another “1999”
It’s been a while since we looked at 2019’s stock market parallels to 1999. Sorry about that… we’ve been too busy reliving 1999 on almost a daily basis, and often not in a good way.
“Quant Quake” But No Market Quake

Value, High Beta, and Small Cap stocks all captured a few rays of sunlight for the first time in a long while. It’s too early to tell if last month’s leadership U-turns can be sustained, but major market trends are the most susceptible to reverse during cyclical bear markets.
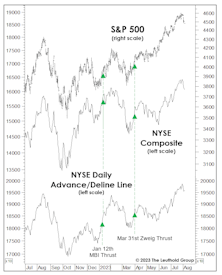
Breadth: Is It Different This Time?
The granddaddy of all technical indicators—the NYSE Daily Advance/Decline Line—continues to make new highs alongside the S&P 500, suggesting the market should move to even higher (but perhaps narrower) highs well into the fall. As noted a month ago, we increasingly suspect that granddaddy may be telling a lie.
Perception for the Professional
March 2026 Issue

Featured Articles
Sector Navigator
March 2026 Issue
