Articles by Phil Segner Sr. Research Analyst & Co-Portfolio Manager
Earnings Momentum

We start 2017 with a robust reading of 1.91. With the painful memory of last quarter’s fast start and terrible finish still fresh in mind, we won’t be celebrating prematurely.
Estimating the Downside - May 2017

This multi-factor estimate of stock market risk is based on a regression to median stock market levels.
Additional Factors

Not a lot of month-over-month action for the S&P 500. But, on March 21st, the index finished down 1.24% putting an end to a run of 110 trading days without a decline greater than 1%—the longest such stretch in 22 years.
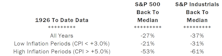
Small Cap vs Mid Cap vs Large Cap

Our Ratio of Ratios has bounced between premium and discount for Small Cap stocks the last few months. Keep in mind that both the S&P 500 and the S&P 600 made new multi-year LTM P/E ratio highs in March.
Earnings Momentum

The Up/Down Ratio sports a final “three-month” reading of 1.33 for Q4. The steady progress seen throughout 2016 came to a halt with the last two months of Q4 results—a disappointment, indeed.
Estimating the Downside - April 2017

This multi-factor estimate of stock market risk is based on a regression to median stock market levels.
Additional Factors

The S&P 500 had a very relaxing and enjoyable February in the Keys. Aside from a regrettable lower-back tattoo, the index basked in a combination of easy gains, virtually no significant down days, and historically low volatility.
Growth vs Value vs Cyclicals

Large Cap Growth is now the best performing segment YTD. After a red-hot 2016, Small Cap Value has gone nowhere in 2017.
Small Cap vs Mid Cap vs Large Cap

After a 2016 year-end spike, our Ratio of Ratios has settled down below its 3% long-term median premium. Large Caps have experienced additional numerator expansion in 2017, with the S&P 500 up 6% versus the Russell 2000 2.3% gain.
Up/Down Earnings: Ratio Sinks To Average

Looking back at January’s robust “one-month” figure (2.07), the current result is disappointing. It was towering 13% above the long-term “one-month” average in January and now sits looking up at the historical “two-month” mean.
Estimating the Downside - March 2017

This multi-factor estimate of stock market risk is based on a regression to median stock market levels.
S&P 500: Another Month, Another Record High

As we get further into the era of Trump, it will be interesting to see how the market balances anti-immigration and anti-free trade policies with deregulation and tax reform.
Growth vs Value vs Cyclicals

Growth stocks scored a modest win over Value in January. This broke impressive streaks of Value domination—Growth’s last win in the Mid Cap space was last June.
Small Cap vs Mid Cap vs Large Cap

After spiking higher in December, our Ratio of Ratios settled closer to its long-term average in January (thanks, in part, to relative underperformance in the Small Cap space).
Up/Down Earnings: Ratio Springs Above Average

Building on the momentum of the past few quarters, our “one-month” Q4 ratio sits comfortably above its historical mean for the first time in seven quarters.
Estimating the Downside - February 2017
The S&P 500 gained 1.9% in January. Based on the 1957-to-date valuation metrics presented, the potential downside compared to its historical average remained the same as last month’s reading (-21%).
Deflationary Fears Decrease

CPI figures for December matched consensus estimates. The Federal Reserve should be pleased to see the modest uptrend in prices. Sustained price inflation still faces a number headwinds including: resource slack, a strong Dollar and a weakening Yuan. Energy prices saw the largest gains in 2016 after a brutal 2015. Within the Core CPI, medical care experienced notable gains.
An Earnings Bottom...What's Next?

It seems like it’s been ages since investors have been able to get excited about earnings growth, although our October 21st “Chart of the Week” showed that the S&P 500’s current earnings slump has been unremarkable in both depth and duration.
S&P 500: Cold Start, Hot Finish

Let’s think back to February of 2016. Oil was in the high $20’s, people were grappling with the concept of negative interest rates, and banks, especially in Europe, seemed vulnerable once again. Energy, Financials, and Industrials stocks turned a scary start into a respectable year.
Value Stocks Kill Multi-Year Trends In 2016

Value stocks reversed long established underperformance to Growth in 2016. However, valuations for these “Value” stocks may have gotten ahead of themselves.
Perception for the Professional
March 2026 Issue

Featured Articles
Sector Navigator
March 2026 Issue
