Articles by Phil Segner Sr. Research Analyst & Co-Portfolio Manager
Earnings Momentum

As we digest the first round of Q2 earnings reports, our Up/Down Ratio sports another outrageous reading of 3.67. If you need a chart to make a case for peak earnings growth, here you go.
Apple Back Tickling 4%
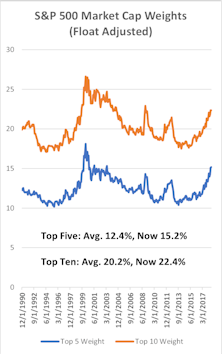
Apple has added 10% to its market value since the end of January, and this action has pole-vaulted the Cupertino firm back into the rarefied air of the “4% Club” (S&P 500 weighting) for the fourth time in six years.
Additional Factors

Small Caps zoomed ahead of Large Caps the last four months. Couple this with the top-25 largest S&P 500 firms still charging higher and we have a very interesting “barbelled” performance profile.
Growth vs Value vs Cyclicals

Growth stocks maintained their dominance over Value in Q2. This outperformance has finally leveled relative historical valuations between Value and Growth.
Small Cap vs Mid Cap vs Large Cap
Our Ratio of Ratios has been stuck in the Small Cap premium range of 2% to 7% for the last ten months—limiting the ability to make a call on market cap preference with this vignette.
Earnings Momentum

Wrapping up Q1 reporting, our Up/Down Ratio is flying high at 2.00. This is the highest “three-month” figure since 1996, even besting those readings immediately following the Great Recession.
Estimating the Downside - July 2018

The S&P 500 squeaked out a monthly gain for June—earning a “turkey” of three positive months for the second quarter.
Inflation—No Surprises Here
.jpg?fit=fillmax&w=222&bg=FFFFFF)
Headline and Core CPI figures hit estimates right on the nose in May, continuing the trend of modest but not outrageous price increases. Energy prices have boosted headline CPI while core CPI continues to be driven by services. With both of the Fed’s mandates pretty much accomplished, appreciate this rare window of time.
Additional Factors
Like a thirty-year-old still living with his parents, the market doesn’t seem to have much direction. Since 1950, the median recovery time (if the market does indeed recover) from an intermediate correction is just 33 trading days. We’re now going on 80 trading days since the low set on February 8th… tick tock.
Growth vs Value vs Cyclicals
Growth’s year-and-a-half dominance over Value continues to roll on. Growth’s substantial gains have almost erased Value’s long-standing relative valuation premium.
Small Cap vs Mid Cap vs Large Cap
Other than an initial bump in the Small Cap premium in March, Small Caps’ last three months’ outperformance hasn’t manifested itself in this vignette.
Earnings Momentum
After Q1’s record breaking “one-month” figure, our “two-month” reading could only disappoint. Still, May’s Up/Down Ratio of 2.01 is one of the highest “two-month” figures in 35 years of observations.
Up/Down Earnings: A Little Shrinkage
Estimating the Downside - June 2018

The S&P 500 held on to its early gains and settled 2.4% higher for the month of May.
Additional Factors

Compared to the first three months of 2018, April turned out to be a bit of a snoozer for the S&P 500. One corner of the index did have a little excitement—Energy stocks. Yes, Energy stocks. The beaten- down, shriveled up sector had its best monthly performance in three years (+9.4%).
Growth vs Value vs Cyclicals

Beaten-up Small and Mid Cap Value stocks performed the best during April. In the Mega Cap space, however, Growth continued to outperform.
Small Cap vs Mid Cap vs Large Cap

This observation falls neatly in the middle of our 2% to 7% Small Cap premium range we’ve observed over the last eight months—providing no real “call” for this vignette.
Earnings Momentum

Our first Up/Down Ratio based on 2018 earnings sports a mind-blowing reading of 3.22—the highest “one-month” figure in 35 years of data.
MTI Remained Negative During April

Read this week's Major Trend Index.
Estimating the Downside - May 2018

After some price appreciation mid-month, the S&P 500 ended April right where it started.
Additional Factors

The index had a quarterly loss for the first time since Q3 2015. Volatility—which had been pretty much non-existent for all of 2017—returned and even had the nerve to persist. With mega caps teetering in March, the Equal Weighted Average scored its fourth monthly win in the last year.
Perception for the Professional
March 2026 Issue

Featured Articles
Sector Navigator
March 2026 Issue
