Inside The Stock Market ...trends, cross-currents, and outlook
Historical Sentiment Measures Not Showing Signs Of Bottom

In looking at Contrarian indicators compared to past major market lows, it seems today’s market has more room on the downside.
The Historical Significance Of Median P/E Valuations

70% of all the market declines since 1945 (post WWII), bottomed within 10% of the median historical normalized P/E ratio.
Playing The Bounce Final Update: Bounce Stocks Small Rally (Finally) In January

We did get a bounce stock rally in January, but it still was a disappointing bounce year overall.
Do You Believe In "Decoupling"

A popular buzz word in recent months is “decoupling”, often used in building a case for investing in fast growing foreign stock markets even though the U.S. economy is entering a phase of minimal economic growth or recession.
2008: Less Than Great

Yes, it is thermal pollution time again. It’s the new year when prognosticators and investment pundits produce large volumes of hot air, probably contributing to global warming.
Dow Double Trouble
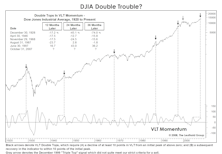
Our VLT (Very Long Term) Momentum algorithm—alternatively known as the Coppock Curve or “Madness of Crowds”—has just rolled over after forming a rare “double top” formation. Why has the rare VLT Double Top typically proven lethal for the stock market?
December Market Action

December’s bi-polar price swings had screens flashing brilliant with traditional holiday colors of red and green.
Playing The Bounce Update: Activated In Managed Accounts As 6% Holding

In mid-December, readers were notified via an Interim Memo of our decision to “Play The Bounce” in our managed accounts.
Four Trends Worth Knowing About On The Supply/Demand Front

Four trends worth noting and their implications for 2008.
Financials: How Low Could They Go?

Expect more downside for Financials, based on the sector’s percentage of S&P 500 market cap, as well as percentage of earnings. An S&P Financial sector weight of 15% may mark the bottom.
Cyclicality Adjustment Made To Leuthol dGS Scores In December

Explanation of Cyclicals Adjustments made to GS Score methodology.
Small Caps' Stumble Is A Global Affair

Small caps have trailed the S&P 500 performance by 12-15% since peaking out on a relative basis in the spring of 2006. International small caps have broken down even more decisively on a relative basis.
Financials Sector – Comparison To S&L Crisis Paints A Bleak Picture Of What Could Lie Ahead

Performance of today’s Financial sector is somewhat tracking the performance during the S&L crisis. Paints bleak picture of what may lie ahead.
Point And Counterpoint: Big Oil

Client disputes Leuthold’s call for big oil to invest in alternative energy business. Read Steve’s in-depth rebuttal.
How Low Will The Fed Go? Bond Market May Be Offering Some Clues
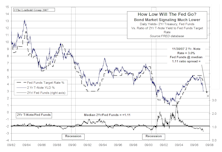
In trying to assess how far the Fed may ultimately be forced to cut rates, the price action in short term Treasuries and historical yield relationships may offer some clues.
November Market Action

The venerable Wall Of Worry finally got to the stock market during November, with the major indexes losing their grip virtually right out of the gates.
Is Mild Stagflation In The Cards?...How To Play It
It is very possible that the early part of 2008 will see a brief period of higher inflation combined with slowing real growth in the U.S. economy.
Time To Revisit "Why We Normalize Earnings"
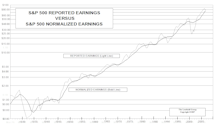
Earnings are very cyclical by nature, the ebb and flow can cause P/E ratios to move in erratic, less meaningful ways.
Bulls May Have Christmas...

Bulls may indeed have Christmas, but fundamentals for bearish case in 2008 are extensive.
VLT Momentum On U.S. Currency...Applications (And Implications) For The Weak Dollar

Quite simply, VLT (which stands for Very Long Term) is a momentum oscillator which works best as a buy signal. Some market technicians have also suggested that VLT Momentum back-tests well as a currency indicator.
Perception for the Professional
May 2026 Issue

Featured Articles
Sector Navigator
May 2026 Issue
