Inside The Stock Market ...trends, cross-currents, and outlook
Volatility Update...No Significant Signs Of Slowing Volatility Yet

So far in 2001, 62% of trading days qualify as Extreme Volatility compared to the historical norm of 4% since 1971.
April Mutual Fund Flows: Net Inflow Returns In April

U.S. focus equity fund net inflow of $15 billion is estimated for April. This reverses the record level $15.7 billion monthly outflow in March.
Insider Block Measures...Insiders Not Buying This Dip

Despite stock price corrections in the last year, significant net selling continues among the “smart money”.
View From The North Country

I am positive about today’s stock market, but there are some considerations that could cause my optimism to be premature. A bubble/bust comparison between the great gold and silver bubble of 1979-1980 versus the 1998-present Internet sector. Not all single digit stocks should be shunned.
Market Breadth Update

Despite the market’s weakness in March, the breadth experienced some deterioration in the last half of the month.
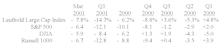
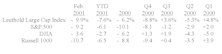
NASDAQ Performance In Longer Term Perspective

How have sharp declines of the past year affected performance over longer time horizons?
Year/Year Equity Group Performance: Wide Dichotomy

The 10 best and 10 worst performing equity groups over the last twelve months.
Volatility Update...No Significant Signs Of Slowing Volatility Yet

In 2000, the NASDAQ was the most volatile it had ever been. However, in 2001, new standards are being set.
March Mutual Fund Flows: Net Redemptions In March

U.S. focus equity fund net redemptions of $11 billion are estimated for March.
View From The North Country

Increased disclosure of mutual fund holdings detrimental to investment performance.
Insider Block Measures...Looks Like Insiders Were Right

In the last ten weeks, a total of $9.8 billion of big block net insider sales have occurred.
April Is The "Opportunity" Month

Bear market broadened out in late March to include other than technology sectors. Never before have so many lost so much.…There is plenty of blame to go around. Academia, The Street, the Media, the “Experts” to name a few.
Capitalization Tier Meausres
Continuing to evaluate Leuthold Index methodology.
Capitalization Tier Meausres
Continuing to evaluate Leuthold Index methodology.
2001...January Bounced...February Trounced

Fortunately, we cashed in, in January. Tech stocks crashed in February. Luck or skill? We’ll take it.
View From The North Country

Navigating safely through the current, turbulent market environment requires more experience, knowledge and training.
Be A Buyer, Not A Seller

Stock selection in a recession is a different ball game! A look at some of the rules and the traps when investing during a recession. The Bullish Message Of Breadth: Demonstration of how divergences between the S&P 500 and the A/D Lines have denoted market tops and market strength.
February Mutual Fund FlowsModerate Net Redemptions In February

This is the first monthly net redemption since August 1998’s $6.6 billion net outflow during the throes of the Asian market crisis.
Insider Block Measures...Looks Like Insiders Were Right

The smart money exodus began back in late March of 2000, when 10-week total “net selling” spiked to an unprecedented 1.8% of total market capitalization. In retrospect, this was a perfect sell signal for equities.
January Mutual Fund Flows: Equity Demand Surges In January

January’s $30 billion net inflow the strongest January on record (beating January 2000).
Perception for the Professional
May 2026 Issue

Featured Articles
Sector Navigator
May 2026 Issue
