Inside The Stock Market ...trends, cross-currents, and outlook
September Mutual Fund Flows...Almost $100 Billion Net Inflow In Last 7 Months

Flow into equity mutual funds continues. Seven consecutive months of net inflow to U.S. focus equity funds, for a total of close to $100 billion.
Revisiting The VIX

While we still believe there are problems with the VIX as a sell signal, our study did reveal some validity in the 1997 to date period.
View From The North Country

Thoughts and commentary regarding the groups in our Select Industries Portfolio, the Mutual Fund Timing scandal, NASD Margin Debt and deficit worries.
NASDAQ & NYSE Short Interest

Ratios decline as volumes increase.
NASDAQ & NYSE Short Interest
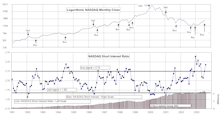
New NASDAQ buy signal as volume declines. NYSE short interest ratio increases again as volume and short interest both decline.
View From The North Country

Even with a clearly improving economy, the deficit estimate for fiscal 2004 as been revised upward to $480 billion. Also, the investment survival value of opinion versus discipline and investing in actual physical industrial metals.
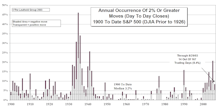
Following The Script?

Yes September is most frequent month to produce declines, but average loss has been only a paltry 1.3%. Also, Septembers following bear market lows (like this year) actually produced strong performance.
Current Earnings Expansion In Perspective....Strong Recovery Continues

The current earnings expansion has so far lasted five quarters. Our projections: $53.50 2003E reported EPS, $58.00 in 2004.
August Mutual Fund Flows...Right In The Comfort Zone

Past bear market recoveries typically saw Main Street investors sit on the sidelines as market conditions improved…..but not this time.
Volatility Update…..Both Indexes Show Lower Volatility In 2003
Volatility continues to fade in the S&P but remains volatile on a historical basis.
July Mutual Fund Flows...The Big Difference A Year Can Make

Main Street’s unexpected return to Wall Street. July marks fifth consecutive month of net inflows, now totaling nearly $60 billion YTD.
Volatility Update…..Both Indexes Show Lower Volatility In 2003
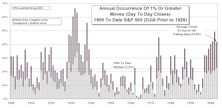
In 2003, the NASDAQ has not been as volatile as in recent years, but is still more volatile than the S&P 500.
View From The North Country

Stage is set for market’s next advance, breaking out of its two month consolidation.
Insider Block Measures....Recent Selling Binge Shows Signs Of Slowing

Despite the recent rise in net selling over the past 5 months, we still view recent buy signals in Q4-2002 and Q1-2003 as bullish for the stock market.
Wind In The Sails

Continue to position our portfolios to take advantage of the current updraft in the U.S. stock market. Economic results and earnings reports continue to surprise on the upside.
NASDAQ & NYSE Short Interest
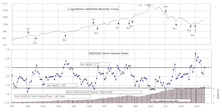
Both the NYSE and NASDAQ short interest ratios saw increases in July.
Equity Group Leadership In 2003

Equity group leadership in 2003…..Top twenty group performance leaders have heavy tech concentration. Health Care also well represented.
An Explanation For The Confusing S&P 500 Book Value Revision?

We still have been unable to get a satisfactory explanation from Standard & Poor’s of why and how they revised their Book Value calculation. The revisions were huge and had a significant impact on our valuation metrics.
Insider Block Measures....Recent Increase In Selling But Reading Still Viewed As Normal

While the recent spike in insider selling has been well documented by the media as an ominous sign for stocks, the YTD level of net selling is down significantly from recent years.
June Mutual Fund Flows...They’re Baaaack!

Unexpectedly, it seems that the public is coming back to the stock market. Best flow since May 2002. Typically, Main Street takes its time coming back to the party. Continued flow to mutual funds is stock market positive.
Perception for the Professional
May 2026 Issue

Featured Articles
Sector Navigator
May 2026 Issue
