Technology
Pretty Darn Neutral
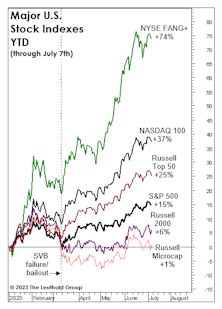
Last month’s title, “Echoes of 2021,” didn’t fully capture the speculative fervor that’s gripped big Technology stocks—and the NYSE FANG+® Index immediately set out to rectify that shortfall by tacking on another 5% to bring its YTD return to +74%.
Herd Instinct

Growth and Tech have been the flagrant winners YTD, yet the SVB crisis triggered further bifurcation: Since SVB failed, it’s been important to own only “big” Growth and “big” Technology, amplifying the multiples of monster stocks, like MSFT and AAPL. Can a major market low occur when investors are herded in a handful of the most richly-priced public companies in history?
2022 Versus Y2K
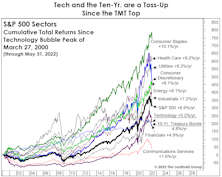
The dot-com bust was so long ago, most are likely unaware just how catastrophic the long-term Tech-stock returns are when measured back to March 2000. Technology has been the third-worst sector performer on a cumulative basis through May 2022; its +5.2% return has barely beaten 10-year Treasuries.
Weigh Those Bags Before Checkout

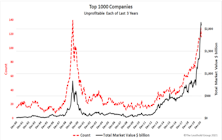
You’ve likely heard of “shrinkflation,” the practice in which a package of M&M’s is reduced from 40 pieces to 32, while the price per bag is unchanged. Publicly-traded companies have been engaged in similar schemes for awhile.
Technology Stocks: Dance Like Nobody’s Watching
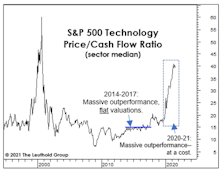
In the middle of the last decade, we marveled at the Tech sector’s ability to flog the rest of the market quarter after quarter, with no meaningful breakout in valuations. Specifically, the median Price/Cash Flow ratio for S&P 500 Technology managed to “hug” the 15x level for about four years beginning in late 2013. Tech’s post-COVID boom is nothing of the sort.
Tech Mania 2.0 Doesn’t Quite Measure Up

In the 24 months leading up to its early-September peak, the S&P 500 Technology sector gained 68%. By comparison, the two-year S&P 500 Technology gain going into its March-2000 peak was 203%. The S&P SmallCap 600 Technology Index doubled in the 23 months leading into the early-2000 top versus the two-year gain of just 6% at its 2020-summer peak.
A Wobble At The Top
.jpg?fit=fillmax&w=222&bg=FFFFFF)
Look, quick! Before it reverses! The Top-5 firms in the S&P 500 have underperformed in September! I’m sorry, you’ll have to forgive my sense of urgency, but the astounding speed and consistency in which these firms have outperformed may have burned the notion into my brain that they can only “go up” (or at the very least beat the index).
Fondly Remembering The Year 2000...
Many equity investors have suggested there’s no comparison between today’s expensive market and the bubble peak of Y2K, pointing out that today’s Technology titans are “real companies” with massive revenue underpinnings.
Is FANG Forever?
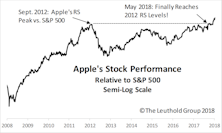
As mania surrounding Apple’s stock was reaching a fever pitch in early 2012, The Leuthold Group wrote a piece entitled, Apple, Just How High Can It Go? To those caught up in the hysteria, the article served as a cautionary reminder.
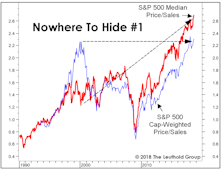
Today Versus The Tech Bubble Peak

We’ve generally spoken of the market’s “broad participation” as a good thing. And from a purely technical point of view, it is.
Beatlemania And Narrow Markets

In April 1964, the Beatles simultaneously held the top-five spots on the Billboard Hot 100, a unique feat in the history of modern music.
Earnings-Release Price Movement Among Sectors/Industries
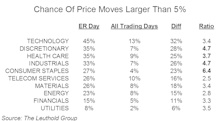
Earnings season is not only important for fundamental investors, it can be equally so for quant managers. For quants that incorporate fundamental data, like us, historical trends and changes in consensus estimates may weigh heavily on model output.
Tech: Prices (And P/E Ratios) Breaking Out

Technology has proven a bright spot in an otherwise disappointing year for our Group Selection (GS) Scores, and it sits atop the sector rankings for the third consecutive month as of October.
Tech In The Pole Position

The S&P 500 Information Technology sector has just broken out to a 15-year relative strength high, and it jumped two spots to the top scoring broad sector position. The breakout in Tech provides a rare example in which foreign market action presaged a major domestic move.
Tech: One Year After The “Bust”

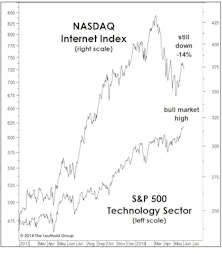
At a time when social media stocks are the rage, stodgy “Old Tech” has quietly tacked on a 20% gain in the 13 months since the social media peak, while the NASDAQ Internet Index is still a bit below its March 2014 high. Yet, “Old Tech” P/CF remains below the level of 1995.
2015 Leadership: An Early Take
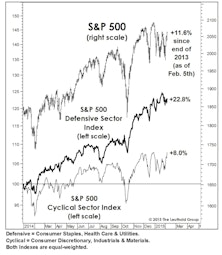
Last year’s economically defensive winners held their grip on stock market leadership in January. This action is consistent with our view that the bull market is an aged, overvalued one that has begun a final “distribution” process that will eventually erupt into a cyclical bear.
Sector Margin Trends

The S&P 500 record median profit margin of 10.3% is now almost a full percentage point above the last cycle’s peak of 9.4% (second quarter of 2007). Trends across S&P sectors are not as uniform as one might expect, though, with only half of the ten sectors last quarter at profitability levels that exceeded their 2001-2007 expansion highs.
The Tech Wreck That Wasn’t
Although the social media darlings haven’t recouped their losses, the Technology Index moved to new cycle highs in early June.
Technology’s Prospects For Long Term Leadership Looking Good

Nine Technology groups are in the top quintile of our group model, and the sector has strengthened on a relative basis after twice “testing” a trendline that dates back to the early 2000’s tech wreck. There’s reason to believe the new uptrend has longer-term legs.
Perception for the Professional
March 2026 Issue

Featured Articles
Sector Navigator
March 2026 Issue
