Sectors
Additional Factors
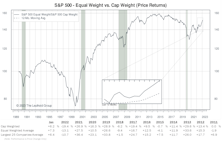
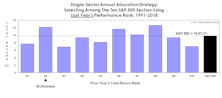
The S&P 500 had an almost biblical upheaval to start 2023. The “last were first” and the “first were last.” In January, the 100 worst performing stocks of 2022 had an average return of +16.1% while last year’s 100 best performers posted +1.7%.
Bridesmaid Sector Track Record
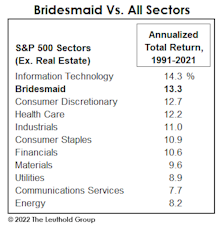
As noted, the Bridesmaid sector strategy has underperformed what has become a more difficult benchmark in five of the last six years. Those poor results have cut the annualized excess return of this approach to just +2.1% since 1991.
Bridesmaid Strategy For Equity Managers
Once again, the idea is to dispense with macroeconomic trends, sector fundamentals, comparative valuations, and to base sector selection solely on the prior year’s total returns.
Newfound Popularity Of Thematic ETFs
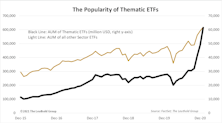
We’ve noticed a small segment of equity ETFs, designated as “thematic,” that is increasingly gaining popularity. Thematic ETFs invest in baskets of stocks that share narrowly-defined business enterprises outside of the standardized GICS methodology.
Sector Bridesmaid Track Record
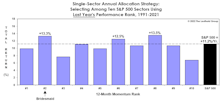
We’ve worried over the last several years whether momentum and other “alpha” factors have become exploited to the point of diminishing returns. It’s an arms race out there...
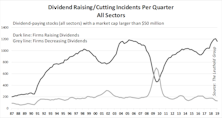
S&P 500 Dividends? Thank You, No!
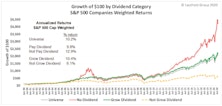
Dividends are a cornerstone of equity investing and over the decades they have produced a significant portion of the stock market’s total return. Previous Leuthold research has identified a strong dividend influence on total returns for small and midcap companies. Looking at S&P 500 constituents, we see that dividend growers outperformed companies that had flat or declining dividends – an expected outcome. However, we also found that companies not paying dividends convincingly outpaced dividend payers. This is contrary to the results in other market segments, but the explanation for this becomes apparent in the course of our research.
The Stock Market & U.S. Presidential Election Cycle Revisited
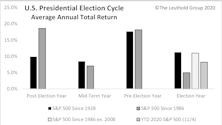
We crunch some numbers to see how 2020’s stock market trends have fared compared to the typical election year, and we slice and dice past post-election year trends at the sector and industry group levels to look at potential opportunities in the coming year.
2021 Earnings: How Do We Get There?
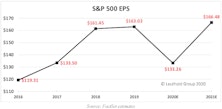
According to FactSet estimates, S&P 500 earnings for 2020 are anticipated to come in near $133 per share, a drop of 18% from 2019 results. Given the widespread business disruptions and closures caused by the pandemic, one might have expected this year’s results to be much weaker.
Research Preview: 2021 Earnings Breakdown
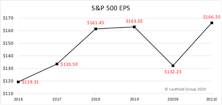
Earnings estimates for 2021 are being projected above the records posted in 2018 and 2019. We ask the question, “How do we get there?” Here we present an introduction to this topic that we will examine at length and provide a full analysis in mid-October.
Popular Low/Minimum Volatility Strategies Disappoint
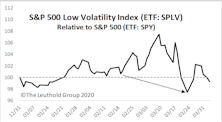
During the peak-to-trough market drawdown through mid-March, some of the most popular Low/Min Vol ETFs did not perform as anticipated. Stable and boring businesses, that weather downturns relatively well, are facing atypical vulnerabilities.
Is Passive Ownership Exacerbating The Sell-Off?
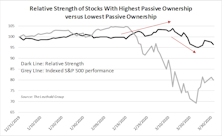
With the enormous popularity of ETFs, we’ve wondered if the high level of passive fund ownership could lead to stock price deviation from company fundamentals, and thus create greater price volatility.
Sector Bridesmaid Track Record
2019 was the fourth consecutive year of underperformance by the annual Bridesmaid sector pick. Those poor results have trimmed the annualized “alpha” of the strategy to just +2.2% since 1991.
Return Implications Of Dividend Cuts
Last month we noted that current interest-rate expectations might indicate good timing for dividend investments; however, we strongly suggested being selective, and lean toward high-quality dividend payers.
Bridesmaid Strategy - Sectors
Our analysis of the Bridesmaid effect originated in 2006, but was based on S&P 500 sectors rather than asset classes.
Sector Rankings

The top-three rated sectors are Health Care, Communication Services, and Consumer Discretionary, with Information Technology dropping from the top-three. Rounding out the bottom end of the rankings, for the second consecutive month, are Materials, Energy, and Consumer Staples.
Market Observations
.jpg?fit=fillmax&w=222&bg=FFFFFF)
It’s been one of the worst years on record for diversification, with our hypothetical All Asset No Authority (AANA) portfolio down 7.2% YTD through yesterday. That’s the second-worst year for AANA since 1972, and there’s probably not enough time left for performance to undercut 2008 (-24.9%) for the bottom spot.
Sector Rankings

For the sixth consecutive month, the top-three rated sectors are Health Care, Consumer Discretionary, and Info Tech. Rounding out the bottom end of the rankings are Materials, Energy, and Consumer Staples.
Leuthold Sector Rankings; Attractive & Unattractive-Rated Industry Groups

For the fifth consecutive month, the top-three rated sectors are Health Care, Consumer Discretionary, and Info Tech. The newly launched Communication Services sector (which replaces Telecom Services) debuts with a strong ranking in fourth place. Rounding out the bottom end of the rankings are Utilities, Materials, and Real Estate.
Research Preview: Sector-Adjusted Factor Returns
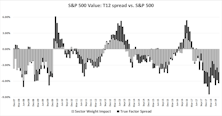
This article summarizes our current research into the interaction between factors and sectors. We find that sector weights have a significant influence on some factor results, while the true factor impact is the key driver for others. Watch for our full report coming next week.
Sector Ranking

Health Care remains the highest-rated sector followed by Info Tech and Consumer Discretionary. These sectors have ranked among the top three since June. At the low end of the rankings are Utilities, Telecom Services, and Materials, all of which have been among the bottom three positions for three consecutive months.
Perception for the Professional
March 2026 Issue

Featured Articles
Sector Navigator
March 2026 Issue
