Sectors
GS Sector Rankings
Read this month's Sector Rankings.
Sector Rankings
Following a seven-month stint as the highest-rated sector overall, Consumer Discretionary relinquished the throne to Health Care.
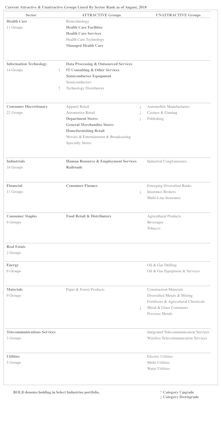
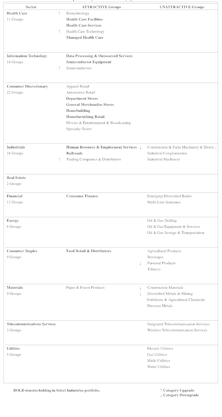
GS Score Sector Rankings With Attractive & Unattractive Rated Industry Groups
Consumer Discretionary can’t be topped; it has held on to the highest-rated spot for seven consecutive months. Utilities and Telecom continue to close out the bottom two.
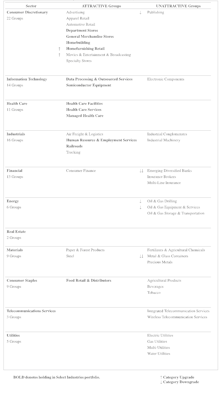
Sector Rankings
Consumer Discretionary has held on to the highest-rated spot for six consecutive months. Coming in last (again) is Utilities. After rating among the lowest two positions between April 2017 and April 2018, Energy finally improved and now sits in 6th place—the middle of the pack.
The Ups and Downs of 2018
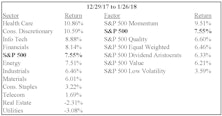
Ten weeks into 2018, we have already seen three mini-cycles in U.S. equities. A rip-roaring surge in January was followed in early February by one of the shortest corrections in history...
Bridesmaid Strategy: Sector Track Record
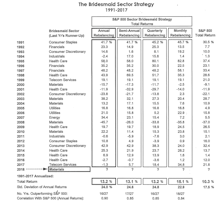
Table 3 shows annual performance results for the Bridesmaid sector strategy under all four rebalancing frequencies, along with the sector selection for the annual version of the strategy.
Sector Rotation: Momentum Versus Valuation Factor
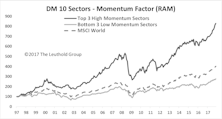
For sector overweight/underweight decisions, applying a Momentum overweight with both EM and DM countries has been most successful.
The Many Faces Of Mo

Momentum is one of the most widely accepted alpha-generating factors, used by quantitative and fundamental managers alike. Its biggest drawback, however, is high turnover. Herein we explore momentum from the perspective of sector weights.
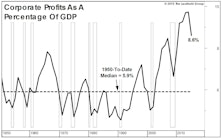
Sector Margin Checkup
U.S. companies hoping for a reduction in the corporate tax rate are not exactly doing a convincing job of demonstrating “need.”
Sector Profit Margins: A Long-Term Review
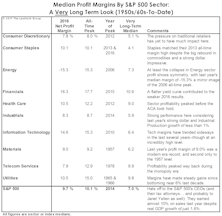
Despite real GDP growth of just 1.6% in 2016, the median S&P 500 company earned a net profit margin of 9.7%, only 40 basis points below the record high established in 2014.
Bridesmaid Sector Track Record
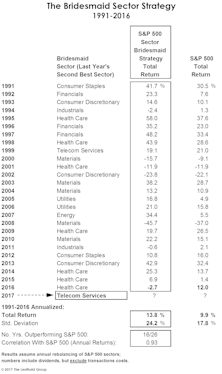
Table 4 shows the annual sector selection and accompanying performance results for the Bridesmaid approach dating back to 1991.
January’s GS Score Sector Rankings
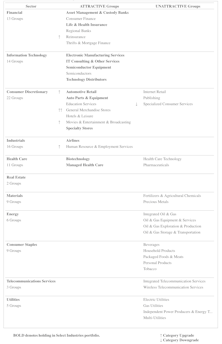
A summary table detailing the Attractive and Unattractive sectors and industry groups going into 2017.
Sectors And Industry Groups On Our Radar

A look at various dynamics affecting sector results in 2016, and what we like going into 2017, both at the sector level and among groups.
Earnings-Release Price Movement Among Sectors/Industries
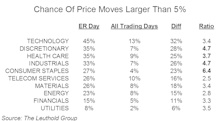
Earnings season is not only important for fundamental investors, it can be equally so for quant managers. For quants that incorporate fundamental data, like us, historical trends and changes in consensus estimates may weigh heavily on model output.
Can Companies Sustain Cash Payouts?
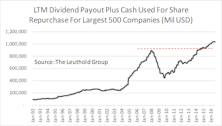
Companies are returning cash to investors at a level never before seen. Counting dividend payouts and outstanding share repurchases, the amount of cash returned back to investors crossed the $1 trillion mark for the first time in January 2016 (based on trailing twelve-months’ total for the largest 500 companies, Chart 1).
Bridesmaid Sector Strategy
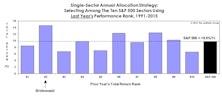
Our original research on price momentum dates back to the late 1960s, and was based not on asset classes but on equity sectors and industry groups. We stumbled upon the Bridesmaid effect, in fact, while testing a handful of simple strategies about a decade ago.
Profit Margins At The Sector Level
A look at profitability trends at the broad sector level; only Utilities and Telecom Services are experiencing levels below their long-term medians.
2015 Leadership: An Early Take
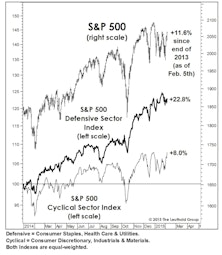
Last year’s economically defensive winners held their grip on stock market leadership in January. This action is consistent with our view that the bull market is an aged, overvalued one that has begun a final “distribution” process that will eventually erupt into a cyclical bear.
Sector Margin Trends

The S&P 500 record median profit margin of 10.3% is now almost a full percentage point above the last cycle’s peak of 9.4% (second quarter of 2007). Trends across S&P sectors are not as uniform as one might expect, though, with only half of the ten sectors last quarter at profitability levels that exceeded their 2001-2007 expansion highs.
Quantitative Factor Performance: What Is Working?
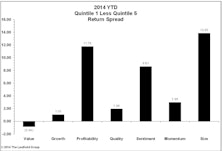
Six of the seven factor categories we track have turned in positive performance so far in 2014; Value is the exception. Lost in the numbers is that most of the value has come from the short quintiles, so it has been hard for managers to take advantage of this trend.
Perception for the Professional
March 2026 Issue

Featured Articles
Sector Navigator
March 2026 Issue
