P/E
Peak EPS: Another Critique
It’s only been a few years since we added the Peak P/E ratio to our suite of market valuation measures. That situates us in the uncomfortable position of having to explain why a big decline in this newer metric might be misleading.
We’re The Government And We’re Here To Help

Our trusted civil servants must have found a list of our old Economic/Interest Rates/Inflation components and began to “discontinue” those once invaluable to us and other Fed watchers. It’s a hindrance, but we still have the one that is most correlated to stock prices and it’s free: The ever-expanding balance sheet.
“Peaking” Into The Future
Peak P/E has just moved into its top decile on a postwar basis. If the recent rally is indeed the first roar of a new bull, then this is a bull that’s a “baby” on a calendar basis, but quite elderly from a “character” perspective.
The Chart Everyone Missed
.jpg?fit=fillmax&w=222&bg=FFFFFF)
When we first met Steve Leuthold in the old company office in a renovated warehouse, he was updating a several-foot-long chart of either the DJIA or S&P 500, by hand, and we got a brief lecture on the importance of using logarithmic scale on price charts.
Small Cap Smack-Down

We were fooled on Small Caps, and it’s been a “multi-factor” catastrophe.
Superhuman Feats Got Us Here
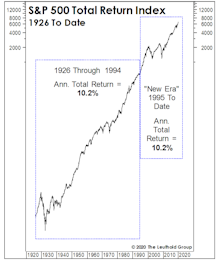
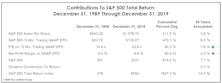
The simultaneous “New Era” ascension in margins and P/E ratios hasn’t generated anything exceptional from a return perspective. To the contrary, annualized S&P 500 total returns over this 25-year period of margin magic and (mostly) escalating P/E ratios merely match “Old Era” returns.
A Spectacularly Average Thirty Years
In the spirit of good holiday cheer, we made a partial concession to the True Believers with a December “Chart of the Week” in which we narrowed our stock market valuation analysis to the historically elevated levels of last 30 years.
Valuations: An Updated “Modern” Take
.jpg?fit=fillmax&w=222&bg=FFFFFF)
An occasional critique of our valuation work is that we consider “too much” market history to form a judgment as to what constitutes “high” or “low.” This type of feedback declined during and after the financial crisis (when historic valuation thresholds were temporarily revisited), but it has become more pointed as the U.S. market has soared to new highs.
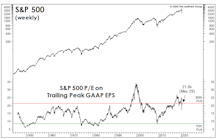
The P/E Decline Has Been Greatly Exaggerated
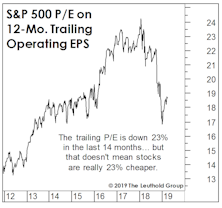
The S&P 500 has bounced back to levels seen at the January 2018 spike high, yet is valued more cheaply than it was 14 months ago.
Beware The Breakout

The S&P 500 finally erased the losses from its nine-day swoon in January and February.
Too Many Clocks
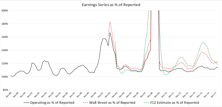
Whatever one’s philosophical leaning, the practice of adjusting earnings has left investors with too many watches to consult. We look deeper into the topic of adjusted earnings to gauge the slippage between commonly-referenced earnings clocks.
Staples Still Stomped Upon

Consumer Staples has historically been the sector most resistant to intermediate stock market corrections, exhibiting an average “downside capture” of less than 40% during all such declines dating back to 1989.
Will Rates Kill The Low Vol Mania?
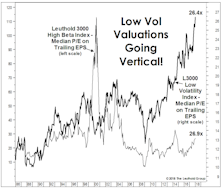
While there are many parallels between recent action and that of 1999-2000, stock market leadership is not one of them.
Bridesmaid Strategy: Low P/E Sector: Annual Results
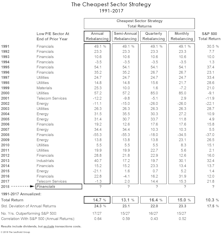
Table 5 shows annual performance results for the Cheapest Sector strategy under all four rebalancing frequencies, along with the lowest P/E sector for the annual version of the strategy.
Value: Scarcer Than In 2000
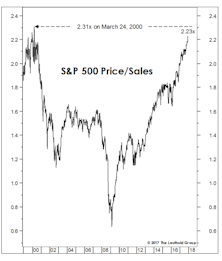
Comparing current valuations to March 2000 is unfair to March 2000. Any Value or Small Cap manager from that era can attest that values became more plentiful as the S&P ascended into its narrow peak.
Valuation-Based Country Selection/Rotation

Despite cyclicality, over the longer term, investing in lower valuation countries ekes out better performance in an EM portfolio, and Dividend Yield showed the most consistency in terms of value factor effectiveness.
VLT Goes “Quiet”
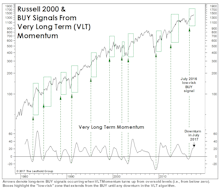
Last year’s “low-risk” BUY signals from our Very Long Term (VLT) Momentum algorithm have proven very profitable, but enough time has elapsed that they should no longer be considered an important bullish factor.
Broad Participation = Broad Overvaluation

We’ve argued for many months that, across all of the U.S. stock market valuation work we monitor, there’s been only one chart that’s truly looked “bubbly”: the S&P Price/Sales ratio.
Where The Bear Lingers
While the next recession could be caused by a variety of factors, we suspect the recovery will eventually end like most post-war expansions, only after a significant rise in interest rates.
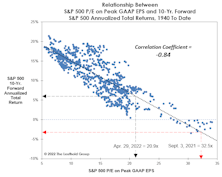
P/E Ratios and Forward Returns: An Update

While it’s not currently the most inflated measure among our Intrinsic Value readings, the S&P 500 P/E on 5-Year Normalized EPS has nonetheless just moved into its tenth historical decile. The latest reading of 23.6x ranks in the 93rd percentile of all observations dating back to 1926.
Perception for the Professional
March 2026 Issue

Featured Articles
Sector Navigator
March 2026 Issue
