P/E
Eye Examination

It’s a throwaway line to say the current bull market is the “most hated in history,” but consider that this hatred in and of itself has led to probably the most dangerous extremity in the stock market today.
Tech: Prices (And P/E Ratios) Breaking Out

Technology has proven a bright spot in an otherwise disappointing year for our Group Selection (GS) Scores, and it sits atop the sector rankings for the third consecutive month as of October.
EM Leadership: Just The Beginning?

Our EM Allocation Model triggered a BUY at the end of August after 5 1/2-years in bear mode. This upgrade is consistent with a cyclical leadership run of one to four years relative to Developed Markets.
Cheapest Sector Strategy
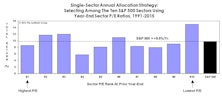
We recognize that—regardless of their empirical appeal—momentum-oriented approaches aren’t suitable for every investor. For those investors, we’ve identified an alternative sector allocation strategy that’s delivered long-term results almost identical to those of the Bridesmaid approach, but which is based on a single, simple selection criterion that should appeal to the most hard-wired contrarian: The Low P/E.
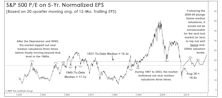
Market Valuation Check
Stocks have long looked expensive on the basis of dividend yield, but now they look increasingly stretched on Forward EPS.
Royal Blues: High P/E Tier Beats S&P 500

The High P/E Tier is now slightly overvalued, the Middle P/E Tier is overvalued, and the Low P/E Tier continues being quite overvalued.
Dissecting The Capital Tier Indices

Sector weight changes during November were minimal.
Finding Value In “Forward Earnings”

Forward earnings might be the greatest Wall Street innovation in history: a tool that makes the stock market look cheap all the time.
Valuing The “Typical” Stock
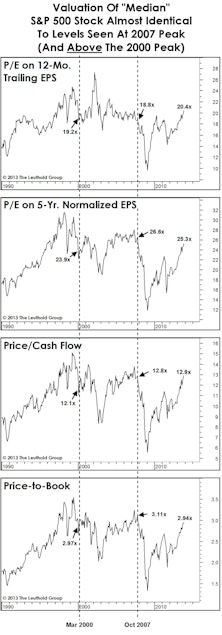
Current median valuations are almost identical to those seen at the bull market highs of March 2000 and October 2007.
S&P 500: Equal Weighted Outperforms In Q3; Maintains Lead YTD
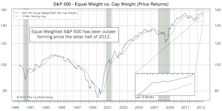
On a YTD basis, the spread between these two indices continues to expand, with the Equal Weighted index now outperforming by more than 4%. Consumer Staples is the most expensive sector among Large and Mid Caps, while Health Care is most expensive in Small Caps.
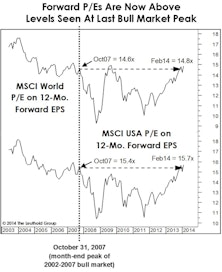
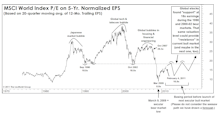
Global Valuations Rising, But U.S. Still At A Premium
The large valuation discount on foreign shares has narrowed a bit, reflecting better relative action in foreign shares over the past 14 months and relatively weaker foreign fundamentals.
Dissecting The Capital Tier Indices

Consumer Discretionary’s weight increased the most in the S&P 500, rising 0.5%. Health Care rose the most in Mid Caps (+0.3%), while Information Technology rose the most in Small Caps (+0.7%).
Time To Bet On China?

Is it time to reverse the “long U.S. consumer/short China” trade?
Worrying About 2019 - A Longer Term Forecast
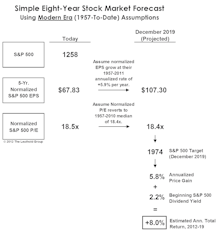
Forecast for 2019 (yes that’s 8 years away) is for S&P 500 to reach 1974 (an +8.0% ACR). Projection based simply on earnings growth and normalized P/E ratios.
China Investing: Segment Valuation May Converge

Interesting development coming out of China recently that is getting little attention. The Chinese government is planning to allow ETFs with Hong Kong listed companies as underlying securities to be traded on the Shanghai and Shenzhen Exchanges.
Market Interrelationships: “Unlearning” What We Thought We Knew
Doug Ramsey examines several once very reliable relationships between stocks, bonds, inflation, and commodities.
Global Valuations: Reverting To The Trough
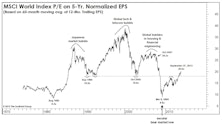
From our perspective as disciples of Normalized EPS, the entire bull market to date has come from P/E expansion. However, that stands to change as global Normalized EPS are again on the rise.
Estimating The Upside
Given the very long-term ebb and flow of market valuations, it is hard to believe that—with old valuation norms finally and decisively violated to the downside—the market will spring back to anything like the valuations seen in the middle of this decade.
Disecting The Capital Indices

Identifying and comparing important characteristics of the broad sectors of the S&P 500.
Crude Oil Regression Analysis

Analyst estimates for oil stock earnings never seem to fully capture the impact that the price of oil has on their earnings.
Perception for the Professional
March 2026 Issue

Featured Articles
Sector Navigator
March 2026 Issue
