Normalized P/E
Tech Watch…..S&P Tech Subset Soared 16% In October
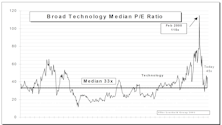
From a much lower base, at least some tech stocks could once again become earnings momentum plays.
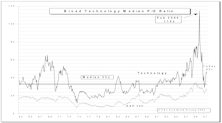
Tech Watch…..S&P Tech Subset Down 19% In September, Down -33% In Q3

On a valuation basis, tech stocks are approaching an attractive accumulation zone.
Tech Watch…..S&P Tech Subset Down 12% In August
Can there be a significant market rally without a tech rally? Maybe not. S&P 500 tech weight (16.9%) now slightly below our “normal” target weight of 17%.
P/E Ratios and Low Inflation...Revisited

Some clients suggested that our use of normalized earnings distorted last month’s study of P/E ratios in low inflation environments. Using a three year centered average of earnings produces results quite similar to last month’s study.
P/E Ratios and Low Inflation

Low Inflation and the justification of expanded P/E ratios. Low inflation does justify expanded P/E ratios...However, how much of an expansion is warranted?
Valuation Considerations

S&P 500 normalized PE and yield in top (worst) decile of 1926 to date data history. From these valuation levels 12 month total returns average a big fat zero.
Avoiding 1991’s P/E Trap

While operating earnings may even now be on the road to recovery, an accounting rule change could produce a virtual earnings wipeout in fourth quarter reported earnings.
Secondary Stock Surge Continues: A Look at the “Secondary Swinger” Issues

Jim Floyd has cranked up another interesting index for us to center attention on “where the action is” in the secondary arena. The study provides a good picture of the wide part of the ultimate narrow door - a group of secondary issues dominating current trading activity.
Stocks Not Cheap, Stocks Not Expensive

Stocks are now in the high 40%-45% of the historical valuation distribution range. This is not cheap, but neither is it expensive. Based on our Benchmarks work, it now appears we can expect average performance for the stock market from today’s levels over 1, 3 and 10 year time horizons.
Avoiding the P/E Trap

Making relative value judgements for cyclicals on a P/E basis can be tricky. These stocks often look the cheapest when they should be sold and look the most expensive when they should be bought.
How Much Upside for Stocks?

Combining historic P/E multiple levels based on various inflation environments, with “normalized” earnings for S&P 500 and DJIA, twelve-month potential for DJIA could be 1177, 151 for S&P 500. More realistic level might be 1115 for DJIA and 143 for S&P 500. However, Bonds might well provide even greater total return.
Perception for the Professional
March 2026 Issue

Featured Articles
Sector Navigator
March 2026 Issue
