Large Caps
The Cycle That Never Was
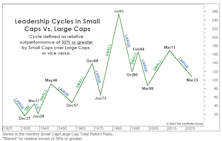
At 144 months, this is now the longest Large-Cap cycle on record, but its dominance will have to prolong to eclipse the second-longest leadership phase (1946-1957), in which Large Caps achieved a 190% performance spread above Small Caps.
Normalizing The Abnormal?
In recent years, we’ve supplemented our longstanding normalized earnings technique with the simpler method of referencing any past peak in EPS (or, for that matter, trailing peaks in other corporate fundamentals, like cash flow and sales per share).
The “Donut” Might Be Healthier Than You Think
.jpg?fit=fillmax&w=222&bg=FFFFFF)
Lent ended last week, allowing Christians to resume the intake of unhealthy foods. But rather than a nice, thick T-Bone steak, we’d suggest sampling one of the few items that’s fattened investors’ accounts in 2022—the Donut!
Bubble Or Not? Two Valuation Takes
In early 2018, we thought the market was expensive, but certainly not a bubble. Today, the trouble is not just high P/E multiples, but the sustainability of the “E” itself—with profit margins nearly 20% higher than ever before. Whether one believes U.S. Large Caps are engulfed in a bubble or not, we have a P/E ratio for you.
Digging Out Of The Red
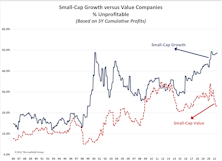
An unprecedented number of companies are still deep in the red, even while the economy is shrugging off the impact of the pandemic. Small-cap growth companies are showing no sign of a quick recovery.
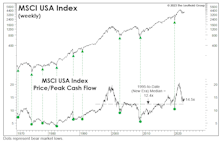
A Pricey Alternative To The S&P 500?
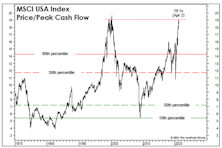
This month we focus on the valuations of the MSCI USA Index—which is nearly identical to the S&P 500. This is worth following mainly because the folks at MSCI are kind enough to provide us with much longer-term histories of Cash Flow and Book Value Per Share.
A “New-Era” Look At The Future
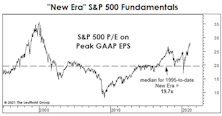
Young readers sometimes give us a not-so-subtle roll of the eyes when we discuss any sort of stock market history that occurred before their date of birth, but it takes experience to appreciate that “there’s nothing new under the sun—least of all in the stock market.”
A Fast Start Comes At A Big Price
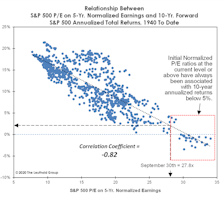
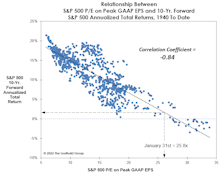
The first up-leg of the bull market has catapulted many Large Cap valuations to levels seen only in 1999, 2000, 2019, and pre-pandemic 2020. At the six-month point on September 23rd, the S&P 500 P/E on 5-Yr. Normalized EPS had already reached 26.9x—a reading that is 30% higher than at the same point of any other bull market.
The Wrong Kind Of “Head Start”
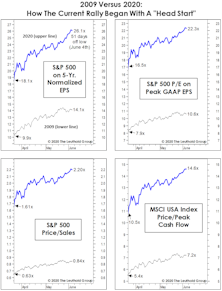
The rally’s initial resemblance to the first up-leg off the secular 2009 market bottom is remarkable. Both rallies started in March, and achieved gains of almost 40% within 50 trading days. Both, of course, sprung from a backdrop of unprecedented monetary stimulus.
A Bear Market In Price, But Not Time
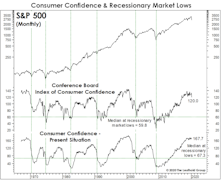
We have a hard time accepting that the excesses associated with an eleven-year bull market and expansion can be fully expunged in 27 trading days, no matter how ugly those days were… keep some powder dry!
A Good Year To “Own It All”
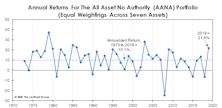
It’s no surprise that U.S. Large Caps were the #1 asset class performer in 2019. We were surprised that last year was the only one of the decade in which the S&P 500 won the annual performance derby. Here we review the annual performance of “Bridesmaid” asset class and sector, “Perfect Foresight,” and Lowest P/E sector.
Valuations: An Updated “Modern” Take
.jpg?fit=fillmax&w=222&bg=FFFFFF)
An occasional critique of our valuation work is that we consider “too much” market history to form a judgment as to what constitutes “high” or “low.” This type of feedback declined during and after the financial crisis (when historic valuation thresholds were temporarily revisited), but it has become more pointed as the U.S. market has soared to new highs.
Risks Still High In The “Median” Large Cap
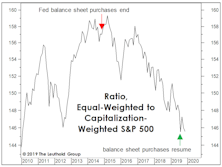
The relative domination of Mega Caps might leave the impression that valuation of the “typical” (or median) Large Cap stock is reasonable. It’s not. The fall rally leaves all major valuation ratios for the median S&P 500 stock in the top decile of the 30-year history, and above the levels prevailing at the September 2018 market high.
We’re All Economists Now!
It’s now been more than 19 months since global stocks peaked on January 26th, 2018. Those lucky enough to have been invested solely in the S&P 500 and to have held on for the volatile ride have a 3.7% gain to show for it. Nice going.
Try This On For Size
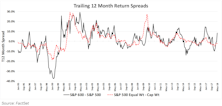
Today’s market is barbelled regarding company size, with the mega-cap Tech stocks and the S&P 600 Small Cap index both outperforming the middle of the S&P 500.
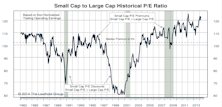
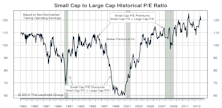
Small Cap vs Mid Cap vs Large Cap
After spending two months in discount territory, in March the Ratio of Ratios headed closer to its historical median premium of 4%.
Navigating The First Rate Hike
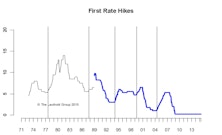
Our current view is the lift-off will be December or later. Assuming inflation will pick up and the Fed hikes the rate by the end of 2015, stocks will perform relatively well, with international stocks a better bet than U.S. stocks.
Stocks Vs. The Dollar—More Complicated Than You Think
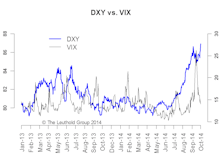
The recent strength in the dollar coincided with a spike in volatility and weakness in risky assets, but the relationship over the last couple years has been tenuous at best.
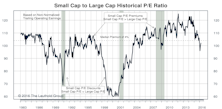
Small/Mid/Large Caps
Small Cap Premium Bounces Back To 23%
Small/Mid/Large Caps
Small Caps are selling at a 20% valuation premium relative to Large Caps (23% last month), using non-normalized trailing operating earnings.
Perception for the Professional
March 2026 Issue

Featured Articles
Sector Navigator
March 2026 Issue
