Bond Yield
Minding The Middle

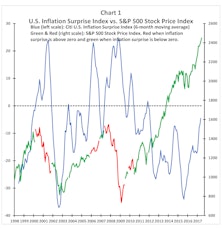
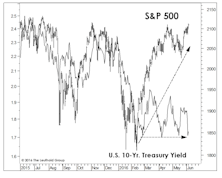
As equity investors, we’ll readily admit to an excessive focus on the Federal Funds rate and the 10-year U.S. Treasury yield.
A “Drug-Free” Market Decline?
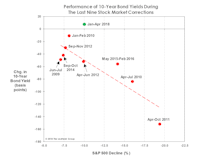
Yields on 10-year Treasuries are up 10 bps since stocks peaked in January, a clear break from the behavior of prior corrections. The last four stock declines of 10%+ were self-medicating—having been accompanied by bond yield declines of 50 to 150 basis points.
Change In Market Character
The Major Trend Index fell into its negative zone last week and we trimmed the already below-average net equity exposure in tactical accounts by a few more points, to a current 41-42%.
1987 Parallels (Part 2)
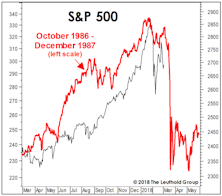
At the risk of yelling “fire” in a crowded theater, we present a few parallels between recent action and the year leading up to the October 1987 crash.
Will Rates Kill The Low Vol Mania?
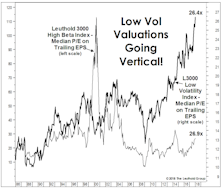
While there are many parallels between recent action and that of 1999-2000, stock market leadership is not one of them.
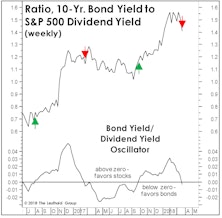
Rates: Does Trend Or Level Matter More?
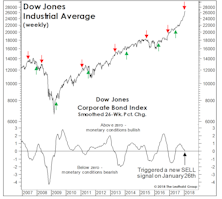
Our Dow Bond Oscillator (chart) issued what looks like an increasingly prescient SELL signal on January 26th.
… Yet Another Bond BUY Signal?
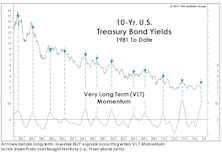
The implication from VLT Momentum is that bonds are sufficiently oversold (or, equivalently, that yields are sufficiently overbought) to trigger some degree of mean reversion over the next several months.
A Mysterious Bond BUY Signal…
Sometimes we feel compelled to report findings that conflict with our outlook. And then there are the even rarer times we actually do it.
Bonds: No Pain, Yet No Gain
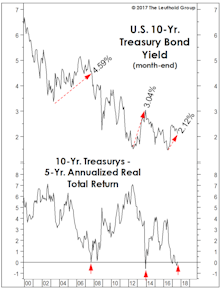
We find it remarkable that the five-year trailing real return on Treasurys has dropped to zero without investors having (yet) suffered any real pain.
Don't "Wage" On A Bond Rally

This morning’s weaker-than-expected reading on wage inflation will no doubt boost applications to the “lower for longer” school of thought on interest rates…
Bonds And Aristocrats

The last year has been a difficult one for any person or theme tied to the “establishment”—including mainstream Republicans, mainstream Democrats, EU commissioners and lobbyists, and, yes, even one of the established leaders of the cyclical bull market—the S&P 500 Dividend Aristocrats.
Where The Bear Lingers
While the next recession could be caused by a variety of factors, we suspect the recovery will eventually end like most post-war expansions, only after a significant rise in interest rates.
Stocks Versus Bonds: A Lonnngggg-Term View
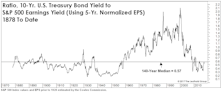
On a 50-year view, stocks do indeed look cheap relative to bonds. But the inclusion of 90 earlier years of data muddies the message.
Rising Rates: Not Always A Death Knell
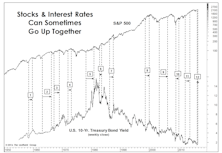
While the Dow Jones Bond Indicator has stood the test of time, history shows that rising bond yields are not always a bearish stock market phenomenon.
Real Bond Returns: Set To Flatline?

While a plunge into a recession could always result in a final “blow-off” phase to the 35-year secular bull market in bonds, any youthful, long-term buyer of 10-Year Treasurys should weigh that exciting possibility against the odds that bonds do no more than match the inflation rate over the next 30-50 years.
Wanted: A Wrong-Way Economist

The travails of active equity managers have been well-documented throughout the year, but there’s been little attention paid to the 2016 plight of economic forecasters—especially ones unlucky enough to have been accurate.
Who’s Selling Bonds?

Yields on 10-Year U.S. Treasury bonds sunk to an all-time low of 1.37% on July 5th, yet so far there’s been a mysterious absence of contrarians willing to step up to say that “the” secular low in bond yields is at hand.
What Are Banks And Bonds Telling Us?
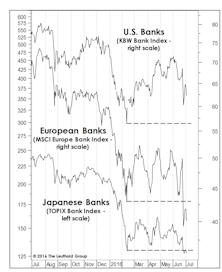
Last month we noted that European and Japanese banks were among the worst-looking industry indexes among the hundreds we monitor—and both groups obliged by dropping 15-20% in the last month.
What Is The Bond Market Telling Us?
We’re tactically bullish, but among the twelve “Charts That Worry Us” published in the April Green Book, we’ll concede there are a few that still worry us.
Improving Indicator Evidence
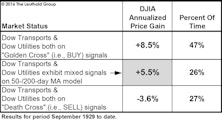
Last spring’s “Double Death Cross” in the Dow Transports and Dow Utilities had been partially reversed even before the February low, when the Dow Utilities’ 50-day moving average crossed above its 200-day moving average (thereby issuing a “Golden Cross”). The Dow Transports remain in a bear pattern based on the 50/200-day relationship, but the gap is closing fast.
Perception for the Professional
March 2026 Issue

Featured Articles
Sector Navigator
March 2026 Issue
