Articles by Phil Segner Sr. Research Analyst & Co-Portfolio Manager
Earnings Momentum

As we roll-in the final month of Q2 earnings, our Up/Down Ratio reads only 1.11. This quarter’s figure was looking back to the best period of the 2018 earnings bonanza (2.06 ratio in Q218).
Box Jumpers Beware!
.jpg?fit=fillmax&w=222&bg=FFFFFF)
Style rotation! Regime change! Market action of the first two weeks of September coaxed the few remaining Small Cap Value managers off ledges from New York to San Francisco.
Reaching A Crossroads
.jpg?fit=fillmax&w=222&bg=FFFFFF)
The Core CPI registered its highest YOY increase of the past year. However, a recent NY Fed survey and other inflation forecasts seems to point to softening expectations. During Fed easing regimes, the CPI has been a good indicator of how aggressive the Fed needs to be. The next few months will be critical in assessing our economic situation.
Estimating the Downside - September 2019

After a gut-check plunge to start the month, the S&P 500 oscillated in a 4% range as investors weighed the trade war, dropping interest rates, and central bank accommodation.
Additional Factors

Yields crashed, gold surged, and investors fawned over low-volatility dividend-paying stocks. The giant, deflation-breathing lizard that has plagued our friends in the Far East for the past three decades seemed like it was lurking just off our shores.
Growth vs Value vs Cyclicals

Our Royal Blue Growth stocks shined with a 2.2% August gain as the rest of the segments faltered. Since the start of 2017: Royal Blue Growth +67.6%; Small Cap Value +0.75%.
Small Cap vs Mid Cap vs Large Cap

Another month of Small Cap underperformance has sent our Ratio of Ratios to a new contemporary low. Looking back to the late 1990s as a guide, a divergence in valuations can persist for several years.
Earnings Momentum

Depending on one’s preferred earnings measurement (operational, reported, GAAP, non-GAAP), YOY earnings growth for Q2 will be zero or, at best, the very low single-digits.
Estimating the Downside - August 2019

The S&P 500 set a fresh all-time high in July and ended the month with a modest 1.3% gain.
Additional Factors

Another record for the S&P 500! Stocks are doing great! Well... not so fast. We closed July with the S&P 500 +1.7% above its high set in the summer of 2018. Contrast that to the S&P 400 and Russell 2000 ending the month still -3.8% and -9.5%, respectively, below last year’s price highs.

Small Cap vs Mid Cap vs Large Cap

Just one year ago, this relationship registered a Large Cap premium of 12%. During the last twelve months, the S&P 500 gained 6% compared to a 6% loss in the Russell 2000 (price return only).
Earnings Momentum

For the first month of Q2 2019 earnings, our Up/Down Ratio reads 1.50. This below-average figure was expected as we continue to work through the rough comparisons from 2018.
Additional Factors

The metaphysical guarantee of a July rate cut chased away the unpleasantness of the May sell-off. In June, the S&P 500 posted its best month since January, and revisited the all-time highs of April and September of last year. Gains were pervasive in June; Google posted the only monthly loss of the index’s largest 50 firms.
Growth vs Value vs Cyclicals

And the nine previous quarters! In an amazing run, our Royal Blue Growth has now outperformed Royal Blue Value for ten consecutive quarters.
Small Cap vs Mid Cap vs Large Cap

Things are starting to get very interesting in this vignette. A sharp move down into Large Cap premium territory is reminiscent of market action in the late 1990s.
Earnings Momentum

Our final Up/Down Ratio for Q1 reads 1.12—in line with the earnings recession of 2015-16. Things don’t get any easier for Q2 as those results will be compared to the highest—and final—Up/Down ratio (2.06) of the 2018 earnings bonanza.
Estimating the Downside - July 2019

The S&P 500 spiked 6.9% higher in June, recouping nearly all the loss incurred in May.
Limbo Rock!
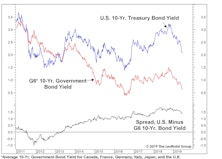
As global rates have taken a precipitous dive the last few months, it’s been hard not to hum “Limbo Rock.” And just like Chubby Checker, we’ve been asking our screens “How low can you go?” on a daily basis.
May Inflation—Dude, Where’s My Rate Cut?
.jpg?fit=fillmax&w=222&bg=FFFFFF)
The latest batch of softer than expected inflation figures gives the Fed more cover for a rate cut. Consumer inflation expectations are now the lowest in two years. Housing price increases remain critical to overall inflation.
Perception for the Professional
March 2026 Issue

Featured Articles
Sector Navigator
March 2026 Issue
