Articles by Phil Segner Sr. Research Analyst & Co-Portfolio Manager
Growth vs Value vs Cyclicals

The market’s love affair with anything “Growth” is translating into the most expensive market-capitalizations for the growth segments that we’ve recorded since the Tech Bubble.
Small Cap vs Mid Cap vs Large Cap

Three consecutive months of outperformance for Small Caps lifted our Ratio of Ratio from its contemporary low set in March. Trailing P/E ratios for both Large and Small-Cap segments are bound to feel significant upward pressure in the coming months as better earnings results roll off the back-end.
Earnings Momentum

Our final Q1 Up/Down ratio reads 0.71. This miserable “three-month” figure is in line with the darkest three quarters of the Great Recession—the worst scores in our 27-year history.
Some Green Shoots Of Reflation?
.jpg?fit=fillmax&w=222&bg=FFFFFF)
May’s month over month CPI results missed expectations but rebounded from April’s plunge. Deflation is still on the table but several indicators have bounced off their lows. Inflation results are less meaningful as large segments of the Index are inaccessible to consumers.
Additional Factors

With the S&P 500 now within spitting distance of breaking even year-to-date, we seem to be witnessing an illusion worthy of David Copperfield. From the market’s perspective, the problems that were very much right in front of us during the limit down days of March seemed to have vanished into thin air.
Growth vs Value vs Cyclicals

Our Royal Blue Growth segment ended May with a 7% YTD gain. In just the first five months of 2020, that grouping has outperformed Royal Blue Value by nearly 21%.
Small Cap vs Mid Cap vs Large Cap

Two consecutive months of outperformance for Small Caps has helped lift our Ratio of Ratios off its contemporary low. During the last two months, the absolute trailing P/E ratio has jumped from 11.6x to 15.9x for Small Caps, and from 18.1x to 22.5x for Large Caps.
Earnings Momentum

With the second month of Q1-2020 earnings in the books, our Up/Down ratio reads 0.75. This is only the seventh reading we’ve recorded below 1.0 in 145 quarters of our Up/Down history.
Estimating the Downside - June 2020

As the S&P 500 rallied 4.5% over the course of May, forward earnings estimates continued to crumble.
Estimating the Downside - May 2020

The historically reasonable prices didn’t last long (although they may return) as April’s +13% S&P 500 bounce pushed our downside-to-median estimate from -12% to -24%—right back to where we were at the end of February.
Additional Factors

April was a month of plummeting payrolls, eviscerated earnings, and crashing commodities—some of the worst data since the 1930s. It was also the best month of performance for the S&P 500 since January 1987 and it helped lower the YTD loss to the single digits. The punishment, it would seem, doesn’t fit the crime.
Growth vs Value vs Cyclicals

Our Royal Blue Growth segment ended the month of April with a 0.3% YTD gain. That hardly seems fair given the economic calamity/uncertainty.
Small Cap vs Mid Cap vs Large Cap

To look at this relationship another way, our trailing Small Cap P/E (13.9x) is in the 24th percentile of observations from 1983-present. Large Caps (20.8x) are in the 86th percentile.
Earnings Momentum

With the first month of 2020 earnings in the books, our Up/Down ratio starts Q1 at 0.72. This miserable figure was expected, but seeing it graphically, in the same ballpark as the great recession, reminds us of the gravity of the current economic situation. And the worst is yet to come!
A “May Day” Revolution?
.jpg?fit=fillmax&w=222&bg=FFFFFF)
With May Day marches and demonstrations cancelled, the workers of the world have one less opportunity to remind us of the ever-widening wealth gap and the evils of the “Top 1%.” It’s a shame, because this was the year that we active managers would have stood shoulder to shoulder with those protesters voicing our own contempt for the “Top 1%”… of the S&P 500.
Additional Factors

Microsoft and Amazon, the #1 and #3 firms by weight, somehow managed to post a positive return for the quarter. The other Tech Titans all posted results better than the overall index—increasing the Top 5 firms’ S&P 500 weight from 16.8% to 19.5% in Q1. This is easily a new record for our 1990-present data set.
Growth vs Value vs Cyclicals

The leadership regime has not been overthrown in this downturn. Large Cap Growth stocks (particularly Tech) have held up relatively very well, widening already huge performance gaps with other styles. Total returns since 2017: Royal Blue Growth +58%; Small Cap Value -26%.
Small Cap vs Mid Cap vs Large Cap

In March, the S&P 500 outperformed the Russell 2000 by a shocking 9.4%. Our Ratio of Ratios is now tickling its 40-year lows, last seen during the Tech Bubble.
Earnings Momentum

Our final Up/Down reading for Q4 stands at 1.18. This is the highest “three-month” number for 2019, a year of earnings that never escaped the shadow of 2018. With the 2016-19 earnings cycle over, we now brace for the coming plunge.
Time To Revisit “Why We Normalize Earnings”
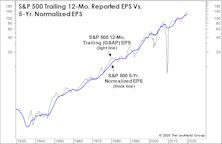
With an economic calamity and the Easter season upon us, we thought this would be a great time to resurrect our “Why We Normalize Earnings” vignette. Long time readers will recognize this as a staple from Green Books’ past.
Perception for the Professional
March 2026 Issue

Featured Articles
Sector Navigator
March 2026 Issue
