Articles by Phil Segner Sr. Research Analyst & Co-Portfolio Manager
Estimating the Downside - April 2020

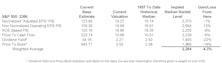
A nice, round -20% Q1 haircut for the S&P 500 took most of the stuffing out of our downside-to-median estimate.
Estimating The Downside
With the markets in freefall, we’ve seen a dramatic spike in interest in our monthly “Estimating the Downside” vignette. We think a mid-month snapshot is in order to give some idea as to how much meat has been taken off the valuation bone.
Saved By Zero (Fed Funds)?
.jpg?fit=fillmax&w=222&bg=FFFFFF)
February’s “Coronavirus Free” CPI data came in a tick hotter than expected. The massive downdraft in risk assets will be extraordinarily deflationary and we question whether the Fed can ride to the rescue once again.
Additional Factors

It took just the last week of February to wipe out the gains of the last four months, as investors fretted about a virus causing a ruinous financial contagion. The invitations for the Bull’s 11th birthday party had already gone out—maybe market participants will be gathering for a wake instead?
Growth vs Value vs Cyclicals

Russell 2000 Small Cap Value is the worst performing style box YTD, down 15%. Its underperformance is nothing new, returning -2% since the start of 2017.
Small Cap vs Mid Cap vs Large Cap
Our Ratio of Ratios now sits near the lows experienced last summer. More interesting though, our Small Cap trailing P/E ratio is at its lowest absolute level (16.1x) since May of 2012.
Earnings Momentum

As we roll in the second month of Q4 earnings, our Up/Down Ratio reads 1.31. While still below average, this is the highest “two-month” figure for 2019 earnings. Our 2018 lookback hurdles are not what they used to be.
Estimating the Downside - March 2020

The last week of February generated a lot of interest in the vignette.
Podcast #13 - Let’s Concentrate For A Moment

In the immortal words of Lloyd Bridges, “Looks like I picked the wrong week to quit drinking.” Let’s put aside this week’s market turmoil and concentrate for a moment on... “concentration.” Market concentration, that is. Close your eyes and think back to those carefree days of mid-February.
Let’s Concentrate For A Moment
.jpg?fit=fillmax&w=222&bg=FFFFFF)
In the immortal words of Lloyd Bridges, “Looks like I picked the wrong week to quit drinking.” Let’s put aside this week’s market turmoil and concentrate for a moment on... “concentration.” Market concentration, that is. Close your eyes and think back to those carefree days of mid-February.
MTI Holds Steady As Markets Gyrate

Read this week's Major Trend.
Estimating the Downside - February 2020

A late-January swoon resulted in the first monthly loss for the S&P 500 since August.
Additional Factors

January’s minuscule loss could have been worse if GAMA (Google/Amazon/Microsoft/Apple) hadn’t continued its incredible run. The single-digit gains from those four names, now 16% of the S&P 500 market cap, buoyed the index by a little over 1%.
Growth vs Value vs Cyclicals

January’s outperformance gap (6%) between Royal Blue Growth versus Royal Blue Value was the largest in four years. After showing signs of life in late 2019, the Value-comeback story seems all but dead.
Small Cap vs Mid Cap vs Large Cap

Another month of Large Cap outperformance helped push our Ratio of Ratios back down to a level we haven’t seen since last summer. Since going decidedly into the Small Cap discount zone at the end of last March, the S&P 500 has outperformed the Russell 2000 by 10%.
Earnings Momentum

Our Up/Down Ratio reads 1.52. This figure is inline with the first three “one-month” readings of 2019, but remains well below the historical average. We’re still two months away from escaping the long shadow of the 2018 earnings bonanza.
Fed Keeping Both Feet On The Wheel
.jpg?fit=fillmax&w=222&bg=FFFFFF)
Headline and Core CPIs both post slower than expected gains in their month-over-month figures. The Fed’s laissez-faire attitude for 2020 seems appropriate for now. Interesting movements in commodity indexes may signal future upward price pressure.
Additional Factors

The S&P 500 plowed through the dour narratives of 2019 and came within spitting distance of its best yearly performance since the Tech Bubble. Microsoft and Apple, a combined 9.1% of the index’s market cap, punched above their enormous weights and contributed +15% of 2019’s total return.
Growth vs Value vs Cyclicals

Those institutionally-loved Large Cap stocks—our Royal Blue Growth and Value indexes—were both up 35% in 2019. Another sign of the affection for these stocks is showing up in their deviation from historical valuations.
Small Cap vs Mid Cap vs Large Cap

After a handful of years dancing around the long-term average, our Ratio of Ratios got off the fence in 2019. The current gap in valuation has been driven by performance; 2019 became the third consecutive year of small cap underperformance.
Perception for the Professional
March 2026 Issue

Featured Articles
Sector Navigator
March 2026 Issue
