Inside The Stock Market ...trends, cross-currents, and outlook
"Oversold" Doesn't Mean BUY
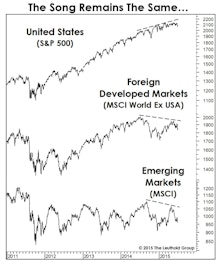
The EM "Trap"

A Page For The Bulls

While we have a high level of conviction on our August bear market call, we should emphasize that our disciplines trump opinions.
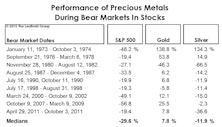
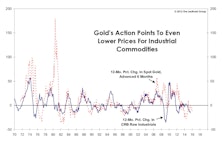
A Lasting Low In Crude?

In our naïve way of measuring market moves, WTI crude oil is about 15% from its $53.27 December 31st closing price. But thanks to financial television, we’re beginning to wise up.
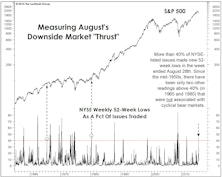
On High Alert
August is “National Eye Exam Month,” but this is the rare year we can confidently recommend that you skip it.
Stock Market Observations
The U.S. stock market has largely shrugged off the latest round of worries related to China’s stock market collapse, the new down-leg in crude oil, a more hawkish tone in Fed-speak, and sizable second-quarter declines in S&P 500 sales and earnings.
Weakening Foundation
Over the last few months, we’ve presented a couple of simple quantitative studies meant to encapsulate the factors driving our Major Trend Index to the brink of bear territory. The chart and table might provide the best summary yet.
Fed Watching For The 21st Century
Deteriorating stock market breadth and worrisome leadership trends both suggest liquidity has already tightened; whether the Fed follows suit in September may now be just a formality.
Too Many Highs, Too Many Lows
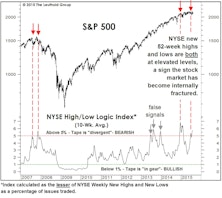
We’ve detailed the growing degree of stock market bifurcation, but the problem for would-be bears is that such bifurcation can reach astonishing levels (witness 1999-2000) before the market is set to peak out.

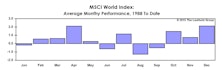
Emerging Markets: A Half-Off Sale!

The Chinese government’s repeated stock market intervention attempts over the past several weeks have been remarkable, and obviously antithetical to the country’s move toward a more laissez faire corporate environment.
The 30/30 Club!
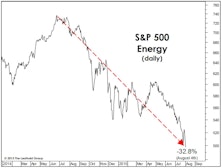
The S&P 500 Energy sector’s latest plunge puts it down by almost a third in the last 14 months. It now belongs to an exclusive list of sectors which have declined 30% on both an absolute basis and relative to the S&P 500!
Chinese Equity Market: Valuation Gap And Going Private

The recent capitulation of the Chinese domestic equity market (or A-shares) makes headlines almost every day. Different theories, circulating in both China and overseas, pop up frequently to explain the daily movement of A-shares. It seems the investment community gets excited when the Chinese market is on the decline (but not so much when the market is on the upswing); many investors are quite reactive to any negative news coming out of China.
Summer Trouble?
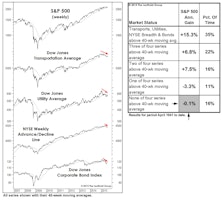
New late-June highs in NASDAQ, Small Caps, and key Financial groups weren’t enough to stem the past few weeks’ slide in the Major Trend Index, which has landed back in its neutral zone (1.01 reading).
A BUY Signal That Says SELL?
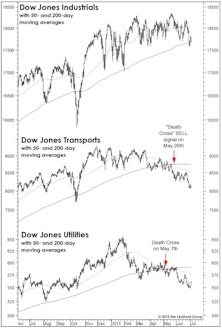
Last month we discussed the negative market implications of May’s “Death Cross” signals in the Dow Transports and Dow Utilities.
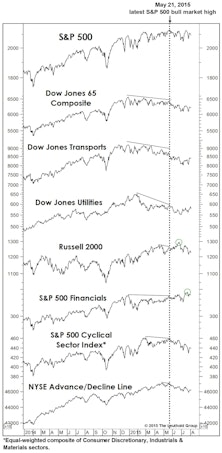
A Page For The Bulls
One could conceivably argue the market is still “cohesive” enough to hold together for awhile longer. June 23rd saw closing bull market highs in the NASDAQ, Mid Caps, Small Caps (both the S&P 600 and Russell 2000), and the critical KBW Bank and NYSE Arca Broker/Dealer Indexes.
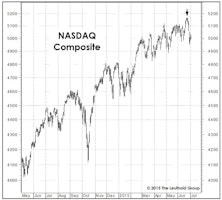
NASDAQ Apathy?
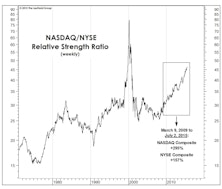
The NASDAQ has solidified its grip on 12-month leadership, rising 11% versus a 4% loss in the NYSE Composite. A surprising feature of NASDAQ’s relative strength dominance is that is has not been accompanied by a rise in relative volume.
Beware The New ‘Wall Of Worry’

The Volume Oscillator discussed in this section is one of several encouraging developments within our Attitudinal work that has sent that category to its least negative reading (-57, Chart 1) since July 2013.
Perception for the Professional
May 2026 Issue

Featured Articles
Sector Navigator
May 2026 Issue
