Inside The Stock Market ...trends, cross-currents, and outlook
The Dow Jones Industrial Index...Before and After
Dow Jones gets a Tech infusion. Still not up to S&P 500 Tech weight.
Volatility Update…On The Rise

October proved to be as volatile as its reputation.
October Mutual Fund Flows

Increased volatility in weekly inflows has been a by-product of the increased volatility of the stock market.
The Big Shrink…Equity Evaporation Continues

Through October, there have been $188 billion of cash acquisitions. This is an all-time record.
View From The North Country

The Internet threatens retail profitability by creating severe pricing pressure. For consumers the Internet has obvious benefits, but the downside is less obvious.
The Big Shrink…Cash Mergers Slowing, But Still Growing

Through September, there have been $172 billion of cash acquisitions. This is an all-time record, over 59% more than the previous annual record of $108 billion in 1998.
Insider Block Measures...Selling At Historical Extremes

The latest reading is now above historical selling extremes.
View From The North Country

Unveiling expanded and improved industry group product this month…Leuthold’s Groups.
October: The Month Of Market Train Wrecks

Steve thinks too many people are looking for an Octber train wreck for it to happen, maybe in November. Market currently very short term oversold.
Volatility Update…Reaching Extreme Levels

Volatility at its highest level since 1974.
September Mutual Fund Flows

U. S. focus equity fund inflows are estimated at $11 billion in September.
Volatility Update...On The Rise

Volatility was high during the month of August, still the second highest yearly level since 1974 (post WWII).
View From The North Country

Inflation is on the rise…normal business cycle inflation, not the rebirth of new secular inflation. Also, the stampede of the lambs…the powerbase for the stock market has moved from Wall Street to Main Street.
September…A New Investment Season Begins

September-October, two months to be wary of.
August Mutual Fund Flows

1999’s cumulative YTD net inflows had significantly lagged behind 1998’s YTD levels until this latest month.
The Big Shrink…Cash Mergers Frenzy Continues
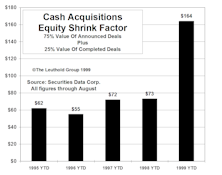
Through August, there has been $164 billion of cash acquisitions. This is an all-time record, over 52% more than the previous annual record of $108 billion in 1998.
Insider Block Measures...Selling Accelerating Again

The latest reading has risen to within 3% of hitting the historical selling extreme.
July Mutual Fund Flows

U. S. focus equity fund inflows are estimated at $12 billion in July, down some from June’s $14.4 billion, and also down from last July’s $15.5 billion.
The Big Shrink…Cash Mergers Slowing In July, But YTD At An All-Time Record

Through July, there has been $146 billion of cash acquisitions. This is an all-time record, over 35% more than the previous annual record of $108 billion in 1998.
Volatility Update…Took A Break In July

With a lack of leadership and little direction in this market during July, the percent of volatile trading days was well below the YTD figure.
Perception for the Professional
May 2026 Issue

Featured Articles
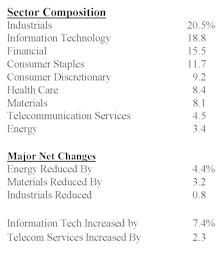
Sector Navigator
May 2026 Issue
