VLT
Mixed Messages From VLT

While VLT for the S&P 500 continued to trend lower in November, the DJIA calculation edged higher and triggered a new BUY signal. The message could soon get more confusing: A BUY signal for the Russell 2000 would be triggered if that index closes December above 1,813, while the S&P 500 and NASDAQ would have to climb more than 11% and 15%, respectively, to trigger a VLT BUY.
The Emerging Markets Dilemma

We’ve been either light on Emerging Market stocks or out of them altogether since early 2011, but have lately been watching for an opportune time to re-enter.
VLT = Very Lousy Timing?

In the spirit of keeping an open mind, three months ago we observed that our S&P 500 VLT Momentum measure had triggered a “moderate-risk” BUY signal with its August reading.
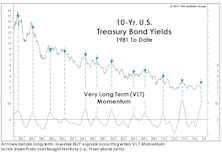
Another Eulogy For The Bond Bull

In the past year, big-name bond gurus have put forth various yield targets that, if exceeded, would provide definitive proof that the secular bull market in Treasury bonds begun in 1981 had finally ended.
VLT Turns Up Again??

A “moderate-risk” S&P 500 VLT BUY signal was triggered at the end of August, but it’s not all good news. Any upturn in the VLT while the indicator is in positive territory also sets up a pattern known to veteran market analysts as the “Killer Wave.”
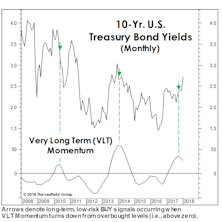
A “Busted” Bond BUY Signal
Last October our VLT algorithm recorded a bond BUY signal—one that we said, at the time, conflicted with our outlook.
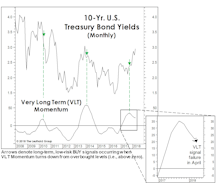
What Yield “Kills” The Secular Bond Bull?
Bond market strategists remain hell bent on identifying the key yield level on 10-year Treasuries at which one can finally declare an end to the 1981-20XX secular bond bull market.
A Mysterious Bond BUY Signal…
Sometimes we feel compelled to report findings that conflict with our outlook. And then there are the even rarer times we actually do it.
VLT Goes “Quiet”
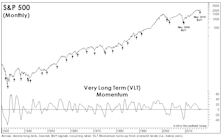
Last year’s “low-risk” BUY signals from our Very Long Term (VLT) Momentum algorithm have proven very profitable, but enough time has elapsed that they should no longer be considered an important bullish factor.
What’s Ailing Small Caps?

While the Russell 2000 loss during the 2015-16 correction was almost double that of the S&P 500, the decline did not fully erase the P/E premium Small Caps have enjoyed since the middle of last decade. The premium might need to be entirely erased before a multi-year Small Cap leadership cycle can begin.
Not Much “Lift” From VLT “BUY”
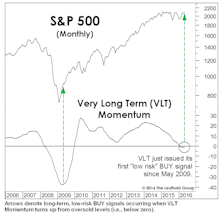
In the June Green Book, we professed some skepticism surrounding the long-term, “low-risk” BUY signal for stocks that was triggered at the end of May by our Very Long Term (VLT) Momentum algorithm (also known as the Coppock Curve).
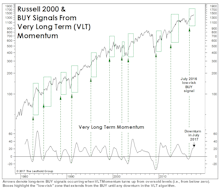
More Upside For Small Caps?

There was a major cyclical BUY signal (VLT Momentum) for the S&P 500 in late-May, and as of July’s close, that bullish development was reinforced by a new VLT BUY signal on the Russell 2000.
VLT Says “BUY”
Breadth underlying the 4-month upswing has been stronger than that observed during any other rally leg since 2013. Despite just a 14% correction in the S&P 500 from its peak, a new VLT “BUY” signal was triggered. Failed signals are relatively rare, the last one occurred in December 2001.
Implications Of Oversold VLT Momentum

The S&P 500 decline has yet to come close to a bear threshold, but it’s nonetheless been sufficient to drive the Very Long Term (VLT) Momentum algorithm into oversold territory for the first time since late 2009. In 16 of 21 prior cases, VLT Momentum’s initial oversold reading was a harbinger of a market that was soon to become even more oversold.
Learning From Failures?
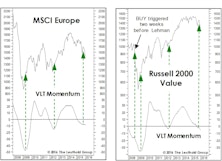
There’s an old trader’s adage which holds that “the most powerful sell signal is a failed buy signal.” Last fall we noted that European equities and Small Cap Value had triggered BUY signals on our Very Long Term (VLT) Momentum algorithm.
BUY Signals In A Topping Market?

Here’s an example of just how disparate underlying market action has become: with the S&P 500 only 2% away from a cycle high, several major U.S. and foreign market indexes have already moved into an oversold position on the basis of our Very Long Term (VLT) algorithm—with a few (including EAFE, Chart 1) actually triggering “long-term, low-risk” BUY signals in the last two months! We are not sure what to make of this action.
TIME: The Hidden Market Risk?

Is there a statistical relationship between the height scaled by a given bull market and its subsequent decline? That correlation is in fact pretty tenuous, we’ve found.
VLT Flashes A BUY On Oil
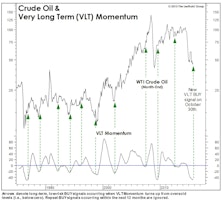
As expected, our VLT Momentum algorithm triggered a “low-risk” cyclical buy signal on crude oil in late October, only the 11th buy signal in the past 30 years. This algorithm was originally designed to identify low-risk entry points into the stock market, but we’ve found it useful with other assets as well.
A Lasting Low In Crude?

In our naïve way of measuring market moves, WTI crude oil is about 15% from its $53.27 December 31st closing price. But thanks to financial television, we’re beginning to wise up.
Oil Prices And VLT

Energy groups continue to rate poorly in our quantitative work, but change will probably be afoot in the second half.
Perception for the Professional
March 2026 Issue

Featured Articles
Sector Navigator
March 2026 Issue
