VLT
A Few Thoughts (And A Lot Of Charts) On The Oil Collapse
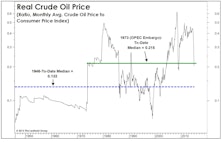
Has the recent collapse in crude oil prices presented us with a good opportunity for an outright commodity investment? No. Energy stocks aren’t on our radar screen either.
“Overbought” Can Be Good Or Bad
The notion of “overbought” and “oversold” markets might be the costliest concepts ever developed by stock market technicians. The very words imply some sort of excessive condition that’s prone to naturally self-correct.
A Milestone You Might Have Missed
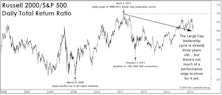
The fifth anniversary of the bull market was met with fanfare, but the launch of the Large Cap leadership cycle in April 2011 is receiving no attention whatsoever.
Group Scores Worked Well In 2013, What We Like For 2014
All five factor categories did well, and the best performing Attractive industries came from six different sectors and ranged from traditionally defensive to more cyclical groups.
Timing The “Taper”
The new debate over the QE “taper” erupted at the same time that a long-reliable Fed-tracking tool is telling us it’s time to ease.
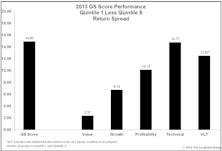
Q1 Review of Group Selection (GS) Scores
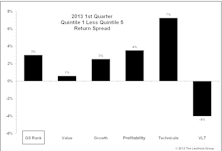
After a recent rough patch due to a multitude of factors (macro driven markets, high correlations, etc.), our domestic Group Selection (GS) Scores started seeing more consistent performance during the fall of 2012. This continued through the first quarter of this year, with the Attractive to Unattractive return spread at +3.0% year-to-date.
New Highs, And Then What?

We are in clear view of the “Twin Peaks” S&P 500 highs of the last decade and these should be eclipsed by mid-year. But when the S&P 500 is adjusted for inflation or denominated in Swiss Francs or Gold these highs may prove elusive.
An “Oversold” Market Turns Up

VLT Momentum fired long-term BUY signals at the end of July on the Russell 2000, MSCI World Index and EAFE - and more signals could be coming…
VLT And Foreign Markets

Exploring VLT (Very Long Term) Momentum readings in foreign markets versus the S&P 500.
Bull Market Extension?

VLT has turned up for most market indices. Even though it is still above the zero line, history shows that this signals an extension of the bull market.

Struck Down By The "Killer Wave"
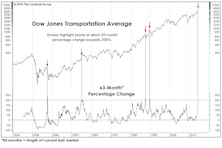
Last January we noted the appearance of a rare and dangerous technical configuration in the Dow Jones Industrials Average. Some analysts have described this topping pattern as the “Killer Wave”, and did it ever live up to that nickname in 2008.
Materials: From First To Worst
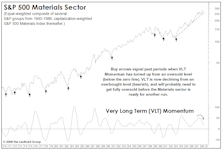
Materials sector has fallen fast and hard in our GS Score rankings and is now the worst rated. Still see further downside based on valuations and technical factors. No, we do not think the underlying commodities can outperform while the stocks fall.
Client Question: VLT Buy Signals

“Given the broad declines in the stock market since October 2007, are there any particular industry groups which are beginning to look washed out enough to trigger a buy signal on the VLT work you employ in your Group Selection Scores?”
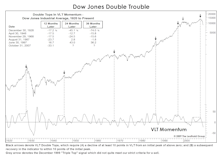
Dow Double Trouble
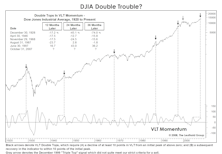
Our VLT (Very Long Term) Momentum algorithm—alternatively known as the Coppock Curve or “Madness of Crowds”—has just rolled over after forming a rare “double top” formation. Why has the rare VLT Double Top typically proven lethal for the stock market?
VLT Momentum On U.S. Currency...Applications (And Implications) For The Weak Dollar

Quite simply, VLT (which stands for Very Long Term) is a momentum oscillator which works best as a buy signal. Some market technicians have also suggested that VLT Momentum back-tests well as a currency indicator.
The VLT Momentum Indicators…..Third Buy Is A Charm

VLT Momentum registers another buy signal. Only in the 1930s has a similar pattern of buy signals developed. Third buy led to big gains back then.
The VLT Momentum Indicators…..New Buy Signals On S&P 500 & DJIA

VLT Momentum, a long term technical measure, recorded buy signals on S&P 500 and DJIA. This is a very reliable indicator.
De-Mystifying VLT Momentum

An explanation of VLT Momentum (The Coppock Curve); what it is and how we use it.
VLT Momentum Buy Signals...Good News For Small Cap Fans

Maybe we are too cautious about calling a turn in relative small cap performance. VLT work on Russell 2000 and Value Line now both giving buy signals.
Perception for the Professional
March 2026 Issue

Featured Articles
Sector Navigator
March 2026 Issue
