Total Returns
Superhuman Feats Got Us Here
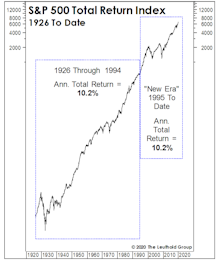
The simultaneous “New Era” ascension in margins and P/E ratios hasn’t generated anything exceptional from a return perspective. To the contrary, annualized S&P 500 total returns over this 25-year period of margin magic and (mostly) escalating P/E ratios merely match “Old Era” returns.
Bridesmaid Track Record
Here are the historical annual performance results for the hypothetical Bridesmaid strategy.
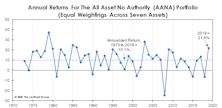
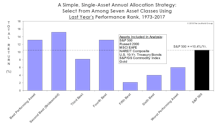
Momentum Across Asset Classes

For those not blessed with clairvoyant asset selection ability, we’ve developed a simple single-asset portfolio strategy that’s handily beaten the AANA Portfolio and the S&P 500 over the long-term.
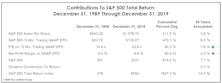
A Good Year To “Own It All”
It’s no surprise that U.S. Large Caps were the #1 asset class performer in 2019. We were surprised that last year was the only one of the decade in which the S&P 500 won the annual performance derby. Here we review the annual performance of “Bridesmaid” asset class and sector, “Perfect Foresight,” and Lowest P/E sector.
A Spectacularly Average Thirty Years
In the spirit of good holiday cheer, we made a partial concession to the True Believers with a December “Chart of the Week” in which we narrowed our stock market valuation analysis to the historically elevated levels of last 30 years.
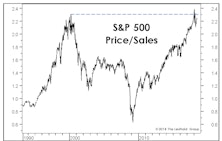
A Scary Chart, Revisited

For a couple years, we’ve labeled the S&P 500 Price/Sales ratio as the scariest chart in the Leuthold database, and last year’s decline did little to improve its intimidating appearance.
Same As It Ever Was?
February’s Oscar win validated our efforts to make the ‘Green Book’ suitable for all audiences, like our decision to relegate “bottom-quartile” valuation outcomes to the very back of the publication.
Asset Allocation: As Bad As It Gets
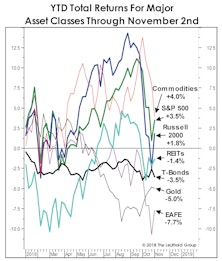
Asset Allocation in 2018 is about as bad as it gets. No major asset class has done well.
For Asset Allocators, As Bad As It Gets!

During 2018, no major asset class has done well, and in most respects the opportunity-set available this year has been among the worst in the last 50 years.
Monitoring Mo’s Mojo
.jpg?fit=fillmax&w=222&bg=FFFFFF)
Momentum is one of the most successful investment styles over the long run, and does particularly well in the later stages of a bull market during the run-up to an eventual peak.
“Unlevered” Treasuries Aren’t A Bubble
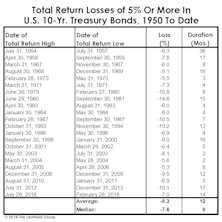
It’s been popular to argue that U.S. government bonds are a bubble while U.S. equities are not. But even if we agreed, the potential cyclical total return losses in Treasury bonds are a fraction of those likely to occur in an equity bear market.
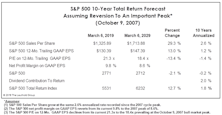
How The S&P 500 Could Hit 2,500… Ten Years Out
.jpg?fit=fillmax&w=222&bg=FFFFFF)
Yesterday was the six-month anniversary of the S&P 500 bull market high, and the index celebrated the event by nearly setting a new peak. Meanwhile, the S&P 500 Total Return Index did make a new high on Wednesday.
Altitudes Are Too High— And Attitudes Are Getting There
An important feature of this bull market—and a reason for its longevity—is the slow recovery in investor attitudes relative to valuation altitudes...
A New Hurdle For An Old Bull?

The first quarter S&P 500 earnings “beat” rate stands to be the highest in history, as any CEO with a pulse has learned to lower the hurdle.
The Bear Market No One Discusses
.jpg?fit=fillmax&w=222&bg=FFFFFF)
Yields on 10-year Treasury bonds have still not breached the 3.00% level that many believe will stick the proverbial “fork” in the secular bond bull market that began in 1981. That could well in happen in the next few weeks, but we believe it’s important to step away from the daily fray and reflect upon the damage that’s already been done.
What Yield “Kills” The Secular Bond Bull?
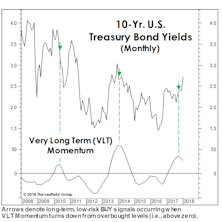
Bond market strategists remain hell bent on identifying the key yield level on 10-year Treasuries at which one can finally declare an end to the 1981-20XX secular bond bull market.
Bridesmaid Strategy: Sector Track Record
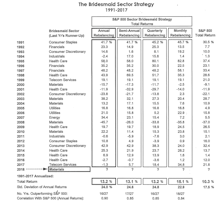
Table 3 shows annual performance results for the Bridesmaid sector strategy under all four rebalancing frequencies, along with the sector selection for the annual version of the strategy.
Bridesmaid Strategy: For Equity Managers

Our analysis of the Bridesmaid effect originated more than a decade ago, with an initial focus on equity sectors rather than asset classes.
Bridesmaid Strategy: Track Record

Last year’s Bridesmaid gain of +21.8% matched the benchmark (obviously, since it was entirely invested in the benchmark).
Asset Allocation: Buy Strength Or Weakness?
We are contrarians at heart, but learned quickly that successful contrarian investing is far more complicated than simply buying assets that are down the most in price.
Perception for the Professional
March 2026 Issue

Featured Articles
Sector Navigator
March 2026 Issue
