Small Caps
Extreme Factor Dispersion

Dispersion remains elevated among factors, with growth selling off and momentum turning in extreme performance spreads. Low-volatility names finally did well after a long stretch of underperformance.
Small Caps: Unresponsive
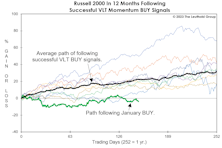
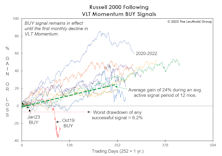
Based on successful Russell 2000 VLT BUY signals, 1982-forward, the index had gained an average of 23% eight months later—and none had a losing position. Since the VLT BUY on January 31st (eight months ago), the Russell 2000 has dropped 3.9%. Furthermore, Small Caps bottomed 15 months ago, and in a normal cyclical bull market, the Russell 2000 would be up 50-70% by this time.
A Small-Cap Conundrum
Data included in the accompanying tables are normally placed in the Green Book’s Appendix, but we added them here to make an important point: Deteriorating market breadth and Small-Cap underperformance are not necessarily the same thing.
Factor Tilt Update—June 2023
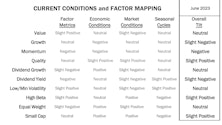
This Leuthold Refresh updates our Factor Tilt analysis, an ongoing process to evaluate the attractiveness of commonly accepted investment styles. Factors are investment characteristics that have historically produced excess risk-adjusted returns, but relative results fluctuate over time.
Small Caps Missed The Memo

For the first time since 1946-47, the super-bullish, six-month window beginning with the mid-term elections through the following April, failed to see a material upswing in Small Caps.
Small Caps Getting Cheaper By The Day
It was September 2020 when we suggested that a new multi-year phase of Small-Cap-stock leadership had begun. Almost immediately, the Russell 2000 reversed a big chunk of the prior decade’s underperformance. Unfortunately, that was the extent of the run.
QE Fuels Inequality—Even Among Stocks
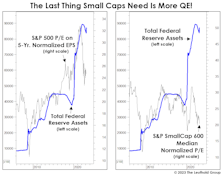
We don’t know enough about banking-system mechanics to conclude if the Fed’s balance-sheet increase associated with March’s bank bailout constitutes a new round of QE. But if it is, we’re skeptical equity investors should celebrate it. In fact, those running Small-Cap portfolios should probably fear it!
The Cycle That Never Was
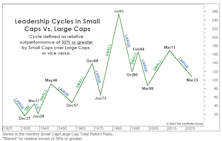
At 144 months, this is now the longest Large-Cap cycle on record, but its dominance will have to prolong to eclipse the second-longest leadership phase (1946-1957), in which Large Caps achieved a 190% performance spread above Small Caps.
Small Caps: We’ve Seen This Setup B-Four
In mid-2020, we wrote that a new multi-year leadership cycle had probably begun. Technically, that belief hasn’t been disproven, but the extent of outperformance has been disappointing in the nearly three years since.
Small Cap Malaise
Imagine telling a Small Cap investor in mid-2018 that: (1) the U.S. economy would spend all but two months of the next 4-1/2 years in expansionary mode; and (2) M2 money supply would increase by 50% in that time, and yet the Russell 2000 would gain a grand total of just 9% over the same span.
VLT Update
The progression of bullish technical evidence since October’s S&P 500 low is compelling, though not overwhelming. With that low now almost four months behind us, the VLT Momentum oscillator for the S&P 500 probably “should” have already triggered a new BUY signal. Yet, both the S&P 500 and NASDAQ Composite are still holding out.
Growth vs. Value vs. Cyclicals
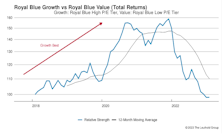
Both Growth and Value Small-Cap style boxes gained 10% in January’s rally. However, SC Growth remains well in the rearview mirror since its relative strength peak in September 2020: Small Cap Growth +8% versus Small Cap Value +60%.
Seasonal Nightmare Ending?

We’ve reminded dejected readers throughout 2022 that this year was statistically “cursed” from the onset. It’s a year ending in “2” and a Shmita year on the Jewish calendar, both of which have been associated with far below average stock market returns. More importantly, it’s a midterm election year, traditionally the weakest of the four-year cycle.
Supercharging VLT With Small Caps

Leuthold did not invent VLT. The credit goes to Sedge Coppock, a technical analyst who insisted on being called an “econometrician.” While the famed Coppock Curve was based on the Dow Jones Industrial Average, Leuthold found the algorithm useful at the industry group level—it is a component within our Group Selection (GS) Scoring system.
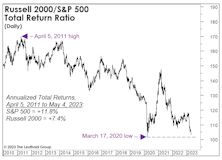
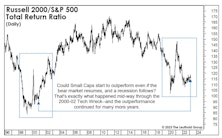
Two Ways To Spin The Russell 2000 “Bear Market”
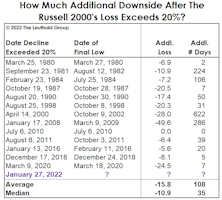
At the market’s January 27th close, the headline blared, “Russell 2000 Enters Bear Market.” Well, not exactly. If one accepts that a 20% decline constitutes a bear market, then the bear actually began on November 9, 2021—the day after the Russell 2000 peak.
Easy Money? Not In Small Caps

One might have predicted that big beneficiaries of war-time-style levels of federal spending, financed by money printing, would be Small Cap stocks. And from March 2020 until March 2021, they were. But the larger picture is sobering.
Small Caps’ Three-Year Ride To Nowhere
Yesterday, the Russell 2000 closed down 20.9% from its November 8th high, and market bulls have conceded it was “due” for a pullback after a 146% gain off the March-2020 COVID lows.
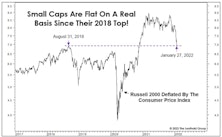
The Russell’s decline is moderate by the historical high-beta standards of Small Caps. However, this drop—combined with other developments transpiring over the last few years—has produced a shocking result: The Russell 2000 is now unchanged on an inflation-adjusted basis since its “Quantitative-Tightening Top” of August 31, 2018. But what a three-year ride it’s been!
Speculating In “The Nebs”
One measure of a bubbly bull market is the degree of speculative fervor embedded in the prices of companies with nebulous, indeterminate, or even nonexistent intrinsic values. Since the bear market low in March 2020, speculative manias have evolved in a menagerie of asset classes including Innovators & Disruptors, SPACs, meme stocks, crypto currencies, and NFTs. Based on the breadth of valuation extremes across numerous and diverse assets, this bull market may rank second to none.
A Squandered Small-Cap Opportunity?

We know our view on this is controversial, but we like the relative prospects for Small Caps—even though we still believe the broad stock market is currently the most speculative one in U.S. history.
Research Preview: Style Swings In 2021
Despite elevated uncertainty over pandemic developments and expected policy tightening, and in the face of aggressive valuations, the S&P 500 still managed to gain a delightful +28.7% in 2021. Even more noteworthy, in our opinion, is that this advance came with nary a single correction of more than 10%.
Perception for the Professional
March 2026 Issue

Featured Articles
Sector Navigator
March 2026 Issue
