Recovery
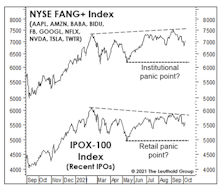
Yet Another Late-1990s’ Comparison

The post-COVID surge in the NASDAQ 100 has been a perfect match in terms of duration with the one following the crisis afflicting Russian debt (and the LTCM debacle) in the fall of 1998. Incredibly, both of these historic market moves lasted 369 trading—but that’s where the resemblance ends.
Deep Thoughts On The Recovery
Massive gains in stock market wealth have undoubtedly been a contributor to inflation, yet few analyses of the inflation picture even mention the stock market—other than to predict it will soar when inflation proves transitory.
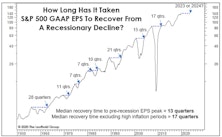
The EPS Recovery And "The Cycle"
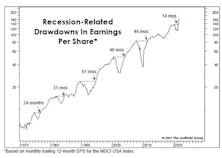
In a couple of weeks, final second quarter EPS for the S&P 500 will confirm the fastest recovery ever from a recession-related earnings decline. That’s old news, and before it has even hit the tape. But we’ve had a sneak peak from the monthly, 12-month trailing EPS numbers published by MSCI for its USA Large Cap Index. Those figures showed that EPS exceeded their pre-COVID peak in May, and the latest reading (through August) is already 22% above the prior high! Simple trendline analysis suggests that EPS for U.S. Large Caps are likely higher today than they would have been in the absence of the COVID pandemic and hyper-stimulative response.
Sizing Up The Profit Recovery
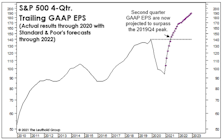
We don’t make much use of “Forward” EPS for the S&P 500 because analyst forecasts have tended to be hopelessly optimistic. But if their short-term projections are on target, when numbers for the current quarter are reported, 12-month trailing GAAP EPS will exceed the $139.47 pre-COVID peak.
An Unwelcome Surprise?
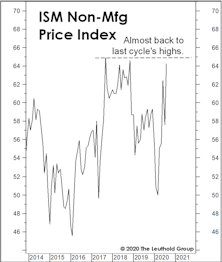
Several measures of U.S. economic “surprises” have soared to all-time highs in the last couple of months, showing that even economic forecasters have finally learned to play the corporate game of “under-promise then over-deliver.” Mind you, that’s only 30 years after most industrial firms eliminated the role of “staff economist.”
2020 Earnings And The Extremophile Market
.jpg?fit=fillmax&w=222&bg=FFFFFF)
As we wade into the waters of second-quarter earnings, muddied by economic shutdowns and suspended guidance, we thought it might be a good exercise to pull back from the “micro” of firm-level beats and misses and examine the “macro” picture that is the Great Earnings Washout of 2020.
Bull Markets Are In The Eye Of The Beholder
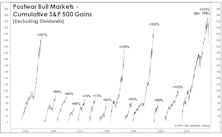
The market’s four-month recovery from the brink of a bear was completed in April, and the ten-year-old bull looks better than ever against all of its post-World War II competitors.
Rally Like It’s 1999
Similarities between 2019’s YTD up-move and the late-2018 recovery are so striking they must make even the most vociferous bear queasy. The trends are identical, but the magnitude of both the absolute and relative performance movements was greater in the earlier experience.
Leuthold Quick Takes: Cyclical Bear Or Recovery Refresh?
The fourth quarter selloff and subsequent rebound, as seen by Doug Ramsey (Chief Investment Officer) and Jim Paulsen (Chief Investment Strategist).
Leuthold Quick Takes: Cyclical Bear Or Recovery Refresh?
The fourth quarter selloff and subsequent rebound, as seen by Doug Ramsey (Chief Investment Officer) and Jim Paulsen (Chief Investment Strategist).
Breakout Or Fake-Out?
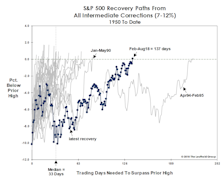
The S&P 500 has fully erased its January and February losses, but there’s probably a market message in the fact that it took so long to do so.
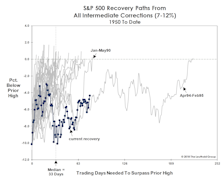
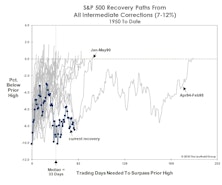
A Launching Pad??
A few clients pointed out that the longest-ever recovery from an intermediate correction (Apr. 1994–Feb. 1995) became the base from which the S&P 500 would eventually triple over the next five years. We’re not equipped to address that possibility in an objective fashion, so we’ll let you be the judge.
Where’s The Spring In The Step?
Old age alone may not kill the bull, but it can make it more susceptible to an array of life-threatening maladies.
Is The Bull Just Napping?
Old age has certainly put no limitations on the bull’s exploits, so we should be cautious in reading too much into its meandering recovery path. However, it’s possible that action since the February low is not a recovery process but rather a countertrend bounce within a larger downtrend.
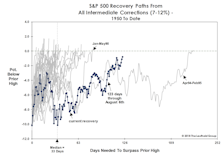
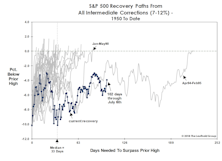
The “Correction” Clock Is Ticking
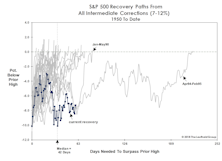
2018’s S&P 500 setback qualifies as an “intermediate” correction. Historically, the duration of intermediate corrections is brief, and recovery time to move back above prior highs has also been brief. This year’s retracement route is already among the most meandering of all recovery paths since 1950.
Market Corrections And The Hazards Of Old Age
In difficult markets, we have become more appreciative of some of life’s small gifts. For example, it’s been quite a while since we’ve heard it argued that this is “the most hated bull market of all time.”
Putting “Our Spin” On The Positive Spin

Bull markets seem to create their own moods that lead to fundamental developments being viewed in a mostly favorable light.
Anatomy Of A Correction

While the current market setback of –5.8% doesn’t qualify as an intermediate correction, it’s close enough to the threshold to warrant a quick review of what such a correction—and the ensuing recovery—might look like.
10-Year: Taper the Taper—Upside Limited
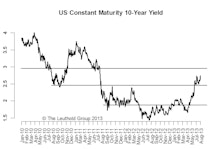
If interest rates keep going higher from here, we would run the risk of derailing a still-fragile recovery. As long as the Fed tapering uncertainty exists, we expect higher volatility on the 10-year yield to persist in the mean time.
Perception for the Professional
March 2026 Issue

Featured Articles
Sector Navigator
March 2026 Issue
