Downside
Estimating The Downside
We remain cyclically bullish on equities, but nonetheless like to engage in occasional downside “target practice” to shape our expectations for the next bear market.
Don’t Call It A Bubble
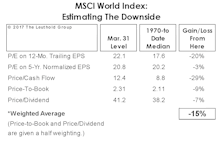
Thanks to reasonable valuations outside the United States, our work finds global equities only moderately above their long-term valuation norms.
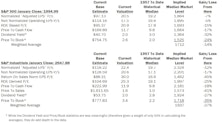
Estimating the Downside - February 2017
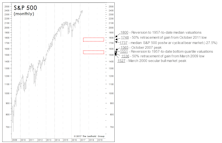
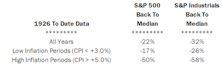
The S&P 500 gained 1.9% in January. Based on the 1957-to-date valuation metrics presented, the potential downside compared to its historical average remained the same as last month’s reading (-21%).
Foreign Equities: Cure For Altitude Sickness?
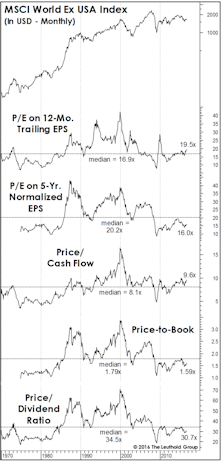
When we complain about the stock market’s inflated valuation levels, we’re unintentionally giving short shrift to the 50% of the global-market capitalization that resides outside the U.S. We’d be hard-pressed to describe the valuation of Developed foreign markets as any higher than neutral.
Bubble Or Not?
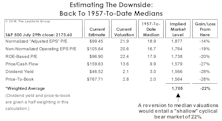
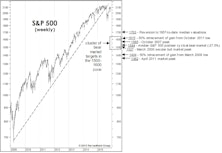
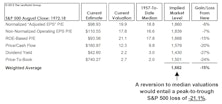
To revisit the all-time valuation peak of March 2000, the S&P 500 would have to reach 3455 (not a forecast!). A reversion to 1957-to-date median valuations implies an S&P 500 loss of 22%. That’s a serious loss, but hardly on the order of a “busted bubble.”
Estimating the Downside - July 2016
Back to the medians (1957 to date): S&P 500 19% downside.
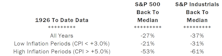
Another Look At Median Valuations
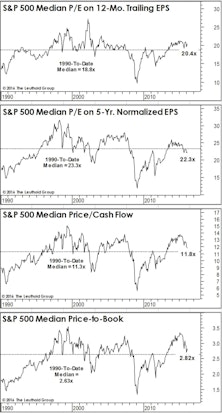
While the past several months’ reversion in valuation measures has certainly wrung some of the risk out of the market, if the bear market reasserts itself and drives stocks to valuations seen at average cycle lows, downside risks are still substantial.
Estimating the Downside - February 2016
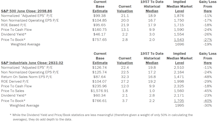
The S&P Industrials’ downside to mean valuation (excludes Utilities and Financials) is 24%, about 3% less than last month’s reading.
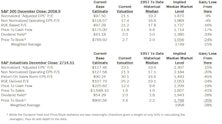
Estimating the Downside - January 2016
The S&P 500 lost 1.8% (price only) in December. Based on the 1957-to-date valuation metrics presented, downside to its historical average decreased by about 2% from last month’s –19% reading.
Estimating The Downside
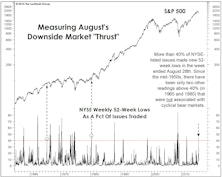
Following August’s market break, we produced a set of potential downside targets derived from a mix of technical retracements, “average” bear market declines, and an assumed reversion-to-the-median in S&P 500 valuations. Little has changed here.
How Far Could It Fall?
"Oversold" Doesn't Mean BUY
Estimating The Downside - February 2015
The S&P 500 lost 3.1% (price only) in January. Based on the 1957-to-date valuation metrics presented below, downside to its historical average decreased by about 1% from last month’s reading of –15%.
Estimating The Downside - January 2015
The S&P 500 lost 0.4% (price only) in December. Based on the 1957-to-date valuation metrics presented below, downside to its historical average decreased by about 1% from last month’s reading of –16%.
Broadly Expensive — Downside To Past Market Highs (And Lows)
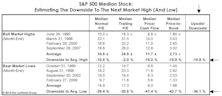
The median S&P 500 stock is now expensive enough that we’re able to estimate its potential downside to prior bull market highs! Based on an average of four valuation measures, the median stock needs to drop about –11% to match the typical valuations at the eve of a cyclical bear market.
Estimating Downside - October 2013
The S&P 500 gained 3.0% (price only) in September. Based on the valuation metrics presented in the table below, the S&P 500 has 9% downside to reach its historical average. The S&P Industrials (excludes Utilities and Financials) now has 22% downside to reach mean valuation.
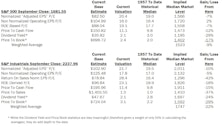
Estimating The Downside - September 2013
The S&P 500 lost 3.1% (price only) in August. Based on the valuation metrics presented in the table below, the S&P 500 is 8% above its historical average. The S&P Industrials (excludes Utilities and Financials) now has 20% downside to reach mean valuation.
Estimating The Downside - August 2013
The S&P 500 gained 4.9% (price only) in July. Based on the valuation metrics presented in the table below, the S&P 500 is 12% above its historical average. S&P Industrials (excludes Utilities and Financials) now have 21% downside to reach mean valuation.
Profit Margins In Retreat....The Mathematics Of The Downside
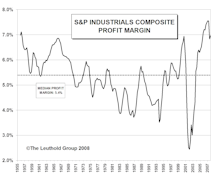
Profit margins contracting. Assuming margins fall back to median historical levels, this implies a market decline of about 18%.
Perception for the Professional
March 2026 Issue

Featured Articles
Sector Navigator
March 2026 Issue
