DJIA
What Does The Dow Have To Say About A “New Bull?”
.jpg?fit=fillmax&w=222&bg=FFFFFF)
Yesterday the NASDAQ 100 closed up more than 20% from its late-December low, prompting the media to enthuse that it had entered a “new bull market!” Sadly, though, the “NDX” has no company among the broad indexes: During this NASDAQ move, gains in the S&P 500 and Russell 2000 have been just 6.5% and 2.9%, respectively, while the DJIA is down 0.5%. (So much for January’s “breadth thrust!”)
Calling “Bull” On Calls For A New Bull
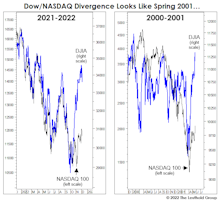
Seriously, another “new bull”—coming so quickly after this summer’s “new bull?” We’ll see. We’re not ones to dismiss price action, because stock prices, in and of themselves, are an important “fundamental.”
But we’ve seen the Dow go rogue like this once before, and it didn’t end well.
Putting Two Market Maxims To The Test
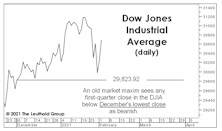
For decades, stock market observers have viewed January’s action as a harbinger for the rest of the year. Is there any merit to that belief?
A “Low-Risk” BUY?!?
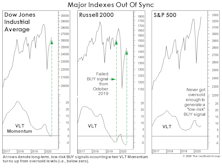
So what do we make of July’s “low-risk” VLT BUY signal on the DJIA—the index on which the indicator’s creator (Sedge Coppock) did his original work? Sadly, not much.
BAA Acting Baaaadly!
Whether or not they’ve risen for the “right” reasons remains up for debate, but the upward move in interest rates has hit the usual suspects very hard in 2018, like early-cycle industries and Emerging Markets.
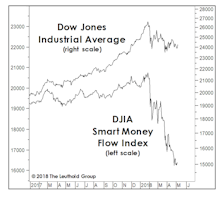
A Smart-Money Split
The Supply/Demand category carries the smallest weighting among the five factor groupings in the Major Trend Index, and this weighting is further diminished by the fact that its components rarely line up in a way which loudly proclaims that an “accumulation” or a “distribution” phase is underway. Today is just another of those typically inconclusive times.
The Market Told You So
First quarter profits have been terrific, and this quarter’s will be too. Enjoy them, but remember that the market “paid” you for them many months ago. Don’t submit another invoice…
This Is A Head-Scratcher
The longest and probably most complex bull market in history is not going to make a clean and decisive exit.
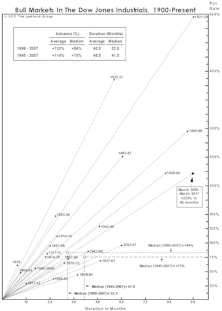
Happy 9th Birthday To An “Off-The-Charts” Bull!
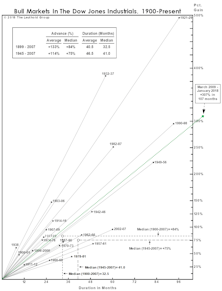
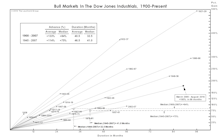
Last fall’s market rally drove the DJIA off (literally) our 1900-Present Bull Market chart. Within a year, this bull jumped two spots to #3 in the all-time rankings dating back to 1900.
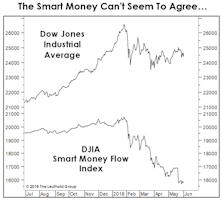
The Smart Money Sleeps In
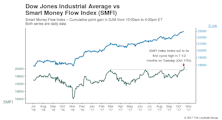
From a purely technical perspective, the bull market has hardly been lacking for feathers in its cap. Yet it earned another one on Tuesday when the DJIA Smart Money Flow Index (SMFI) broke out to a new bull market high (Chart 1), erasing a “non-confirmation” that had stood since March 1st. This index thereby joins the broad list of market bellwethers—chronicled in the last Green Book—that have participated in the parade of new highs.
Breaking The Pattern?
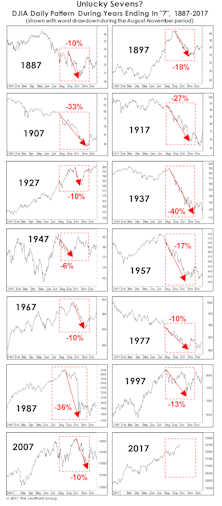
The Chicago Cubs’ break of the 75-year Billy Goat Curse last year might have warned us of the dangers inherent in historical pattern analysis.
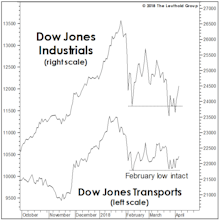
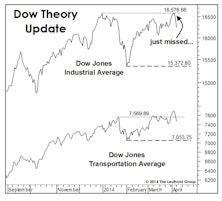
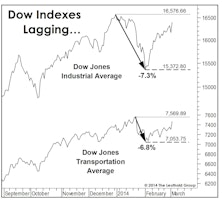
Troubling Transports?
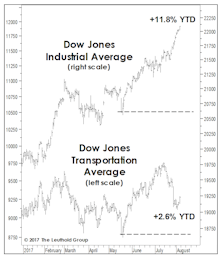
Does the last few weeks’ stumble in the Dow Jones Transportation Average foretell anything sinister? Not on the face of it.
A Subdued 8th Birthday Celebration
The hoopla falls short of that which surrounded birthdays #3-#7; based on the flood of assets into passive stock funds, it appears complacency has set in. Current bull close to becoming longest in history.
A Semi-Annual Checkup!
Call off the mortician, and bring on the pediatrician for the bull market’s 7 1/2-year checkup this month.
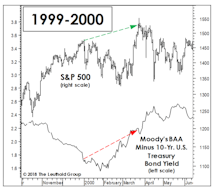
What Is The Bond Market Telling Us?
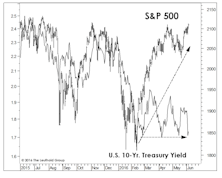
We’re tactically bullish, but among the twelve “Charts That Worry Us” published in the April Green Book, we’ll concede there are a few that still worry us.
A Venerable Monetary Indicator Turned Negative
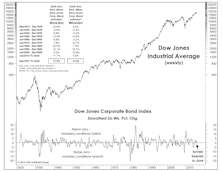
The smoothed, 26-week rate-of-change in the DJ Corporate Bond Index, a reliable indicator of monetary conditions over many different market and economic cycles, turned negative in mid-June.
U.S. Markets See Uniform Strength, While The World Seems Fractured
Based on the historical percentages, the bull market should have a minimum of four to six months of life left. But the market has a way of throwing sand in the gears when you think you’ve begun to understand its internal mechanics.
Stock Market Observations
With our equity exposure high and our disciplines still tilting bullish, we’re naturally more concerned with what might go wrong than missing out on some kind of 2013 repeat.
Bulling Through The History Books
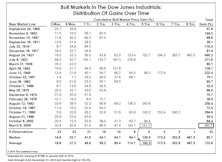
The Dow Jones Industrials’ bull market gain of +150% is well ahead of the long-term median (+86%) and average (+134%), and places the 2009-to-date move as the sixth-best all time.
Market Internals: The Good And The Bad
Leadership isn’t warning of impending weakness in either the U.S. economy or the stock market. Market breadth, on the other hand, is highlighting risks that aren’t evident when inspecting leadership alone.
Perception for the Professional
March 2026 Issue

Featured Articles
Sector Navigator
March 2026 Issue
