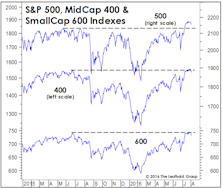
Advance/Decline
Isn’t That Super?

Washed-out investor sentiment and “oversold” stock market oscillators are usually good reasons to get more invested in stocks. But in the case of super-oversold conditions, it is commonly a forewarning that another wave of selling is yet to come.
Reading The Short-Term Tea Leaves
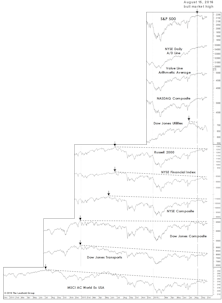
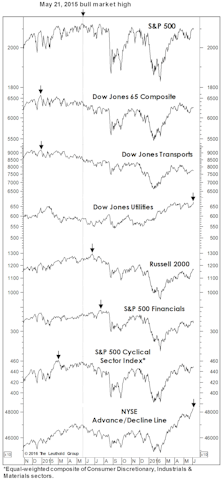
The market’s August push was enough to lift four of the seven lagging bellwethers to new cycle highs. Among the three remaining laggards, only the Dow Jones Transports is still significantly below its high.
“Granddaddy” Tells A Lie

Based on the “granddaddy” of all technical indicators—the daily advance/decline line—we wouldn’t normally be worried that the April 30th high in the S&P 500 could be the final high of the bull market.
Technical Difficulties
Traditional breadth measures have yet to show end-of-cycle thinning of the ranks, but some secondary measures suggest that process may be underway.
The Bulls And Bears Agree!
Yes, bulls and bears now hold their respective positions for the same reason—i.e., the U.S. economy is exceptionally strong. The stock market is accommodating this rare bipartisanship with sufficient reason to support either position.
Assessing The Selling
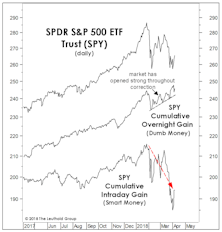
While the January 26th bull market high illustrated none of the hallmarks of a major cyclical top, there are secondary signs that a stealthy distribution process may be underway, such as an overwhelming bias toward opening market strength followed by intraday weakness.
Change In Market Character
The Major Trend Index fell into its negative zone last week and we trimmed the already below-average net equity exposure in tactical accounts by a few more points, to a current 41-42%.
Stock Market Observations
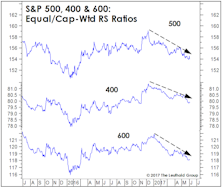
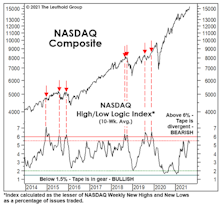
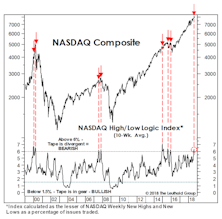
After a two-month lull, stock market momentum reasserted itself in May bringing our summer S&P 500 target of 2,600 back into focus… Meanwhile, we’ve fielded several media calls about the “FANG” stocks’ large contribution to some YTD returns—but that doesn’t diminish the new highs being made elsewhere by disparate groups… NYSE Weekly A/D Line and New Highs/Lows figures also suggest the stock market isn’t yet top-heavy enough to tip over.
Stock Market Observations

Second-half results showed the U.S. emerging from the 2015-2016 profit recession, and our early read is that the first quarter should show more of the same.
Stock Market Observations
The Major Trend Index stabilized in a moderately bullish range during the past several weeks, yet the Momentum/Breadth/Divergence category is almost the sole carrier of the bullish torch.
Stock Market Observations
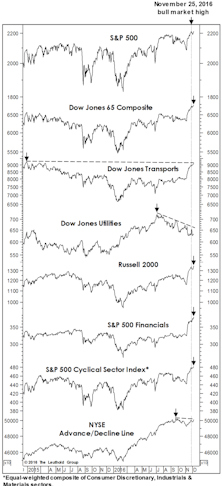
We revisit our “Red Flag Indicator” of prior bull market tops versus today. Usually most of these internal market measures will deteriorate in advance of the final bull market peak. At the latest S&P high, three of the seven leading measures had raised Red Flags, by not confirming, but two of them (DJ Transports and the NYSE A/D Line), are within just ticks of new bull market highs.
Charts: Beware Of Myopia
Despite a two-month stall in the blue chips, the breadth and momentum behind the market’s rally off mid-February lows remain hard to deny.
How Will It All End?

Last month we described ourselves as “long on equities, but light on conviction,” and that description still applies.
Stock Market Breadth: So Good We’re Suspicious
Market breadth measures have been so strong since the February low that we wonder whether something might be wrong with them.
Stock Market Observations
With the S&P 500 levitating near its all-time high, stock market leadership is peculiar—characterized by a flight to quality. And, despite the market’s violent bounce off February lows, there have been only four new market highs set by key indexes on our “Bull Market Top Timeline” table.
Stock Market Observations
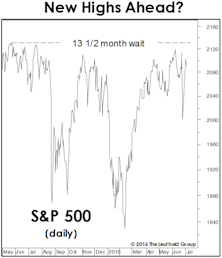
Commentators now label this cyclical advance the “seven-year bull market,” but that won’t be semantically true until the S&P 500 closes above its May 2015 peak of 2130.82.
Weakening Foundation
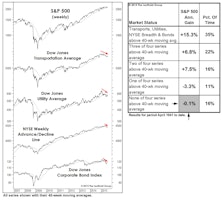
Over the last few months, we’ve presented a couple of simple quantitative studies meant to encapsulate the factors driving our Major Trend Index to the brink of bear territory. The chart and table might provide the best summary yet.
Two Takes On Market Breadth

Market technicians continue to argue that a bull market peak is unlikely to form with the majority of U.S. stocks (and global ones, for that matter) still participating in the new highs of the blue chip indexes.

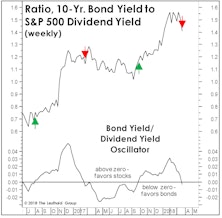
What The Market Tells Us About Fed Policy
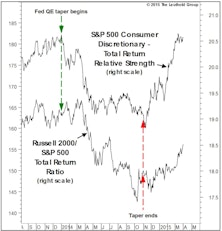
Poor performance in 2014 by two typical victims of Fed tightening—Consumer Discretionary and Small Caps—corroborated our argument that “tapering” is tightening.
Perception for the Professional
March 2026 Issue

Featured Articles
Sector Navigator
March 2026 Issue
