Articles by Greg Swenson Director of Equities
Industry Groups To Avoid
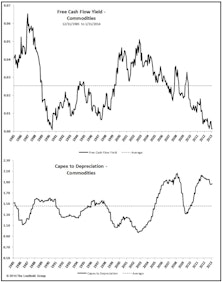
Currently, the Unattractive range of our GS Scores is characterized by two themes, commodity-oriented groups and high dividend groups.
Group Scores Worked Well In 2013, What We Like For 2014
All five factor categories did well, and the best performing Attractive industries came from six different sectors and ranged from traditionally defensive to more cyclical groups.
Sector Performance – Finding Discrepancies
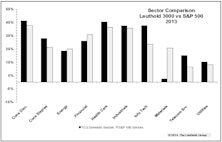
Our Tech sector outpaced the S&P 500 Tech sector by 1400 bps and our Materials sector lagged the S&P 500 Materials by 2300 bps. Here’s why…
GS Scores in 2014
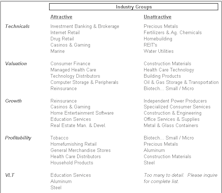
Looking forward, groups from the Information Technology, Health Care, Consumer Discretionary, and Financials sectors look appealing.
Correlations Staying Steady

The decrease in correlations has been helpful for investors, but the lack of volatility in the measure has arguably been more important.
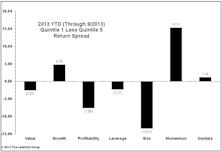
2013 Factor Performance Review

2013 ended up being a good year for quantitative strategies, particularly those that focus on using Momentum
2013 Factor Performance: What Worked? What Will Keep Working?

Momentum and Value worked in 2013. Materials and Financials were the easiest sectors to exploit; Discretionary and Tech the most difficult. Momentum works in December; Value and Small Caps at the start of the year.
Group Models: Finding Opportunity In Controversy
We like Attractive groups that make us cringe at the thought of potentially purchasing them. We take a peek at three groups - Airlines, Education and Managed Care - where we plugged our nose and bought.
How Long Can Small Caps Lead?
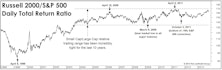
The Russell 2000 is about five points ahead of Large Caps YTD, and is approaching its April 2011 long-term relative peak. We view this outperformance as their leadership’s last gasp and not a new cycle.
Playing The Bounce - With A Twist
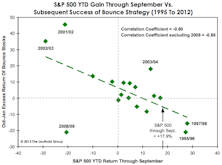
The historical batting average of this strategy has been decent, with gains in 9 of 18 years along with “excess” returns over the S&P 500 in 10 of 18 years. The best Bounce seasons have occurred when the market was either down for the year through September, or up only modestly.
Trading Volume Nothing To Worry About
We take a detailed look at the decline in trading volume and conclude the trend might be a positive going forward.
Sector Performance and Beta Comparisons

There are some substantial deviations in sector performance depending on your constituents and weighting scheme while, simultaneously, betas are converging toward one another.
A Correction Preview?

Was the brief taper-induced pullback a sign of what’s to come down the road? If so, we looked at what factors performed well and what factors didn’t in response to the rising rate environment.
QE Beneficiaries: Highly Levered Firms Outperform

Firms with high debt to equity ratios have been outperforming both the market and firms that rarely utilize debt. When we control for both sector and market cap, the trend is still taking place.
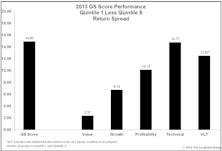
Q1 Review of Group Selection (GS) Scores
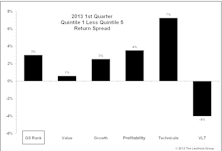
After a recent rough patch due to a multitude of factors (macro driven markets, high correlations, etc.), our domestic Group Selection (GS) Scores started seeing more consistent performance during the fall of 2012. This continued through the first quarter of this year, with the Attractive to Unattractive return spread at +3.0% year-to-date.
Correlations And Factor Performance

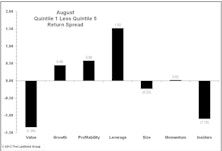
Value factor performance took off at the end of June last year and never looked back; posting positive Q1 minus Q5 spreads every month since.
A Review Of Correlations & Factor Performance

A review of correlations and factor performance. Plus, weighting matters in sector performance as we compare the S&P 500 to our Leuthold 3000 universe.
Factor In Focus: Asset Growth Identifies Lack Of Capital Discipline

Asset growth is a factor that gets some attention, but not nearly as much as other more mainstream factors like price to earnings, earnings growth, etc.
Correlations: Digging Deeper At The Sector & Group Levels

Correlations have been extremely elevated over the past few years when compared to historical levels. The question is, which parts of the market has this impacted the most?
Perception for the Professional
March 2026 Issue

Featured Articles
Sector Navigator
March 2026 Issue
