VLT Signals
Bottom-Spotting In Foreign Stocks

The tale of two markets has existed for years, but now it’s getting ridiculous.
VLT = Very Lousy Timing?

In the spirit of keeping an open mind, three months ago we observed that our S&P 500 VLT Momentum measure had triggered a “moderate-risk” BUY signal with its August reading.
More Upside For Small Caps?

There was a major cyclical BUY signal (VLT Momentum) for the S&P 500 in late-May, and as of July’s close, that bullish development was reinforced by a new VLT BUY signal on the Russell 2000.
VLT Says “BUY”
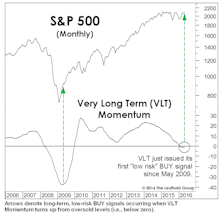
Breadth underlying the 4-month upswing has been stronger than that observed during any other rally leg since 2013. Despite just a 14% correction in the S&P 500 from its peak, a new VLT “BUY” signal was triggered. Failed signals are relatively rare, the last one occurred in December 2001.
A Turn In Leadership?
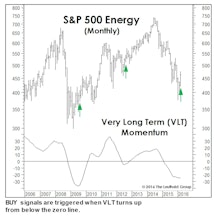
Last month we wrote that a big March gain would trigger a Very Long Term (VLT) Momentum BUY signal on the S&P 500 (Chart). The month’s 6.8% S&P 500 gain wasn’t quite enough to do the trick, but we’re intrigued that VLT did issue BUY signals for three of the market’s cyclical sectors, including Energy, Materials, and Industrials.
VLT Flashes A BUY On Oil
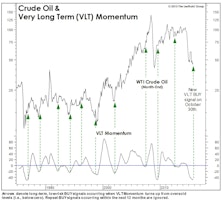
As expected, our VLT Momentum algorithm triggered a “low-risk” cyclical buy signal on crude oil in late October, only the 11th buy signal in the past 30 years. This algorithm was originally designed to identify low-risk entry points into the stock market, but we’ve found it useful with other assets as well.
Perception for the Professional
March 2026 Issue

Featured Articles
Sector Navigator
March 2026 Issue
