VLT Momentum
Small Caps Missed The Memo

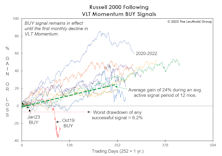
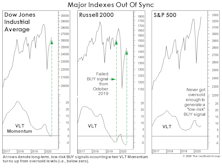
For the first time since 1946-47, the super-bullish, six-month window beginning with the mid-term elections through the following April, failed to see a material upswing in Small Caps.
VLT: You Read It Here Last
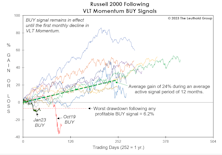
We anticipated it for months, and now that it has finally happened, we’re burying the news in the final page of this section. Yes, the last day of March saw the S&P 500 trigger a “low-risk” BUY signal on our Very Long Term (VLT) Momentum algorithm, known elsewhere as the Coppock Curve.
Small Cap Malaise
Imagine telling a Small Cap investor in mid-2018 that: (1) the U.S. economy would spend all but two months of the next 4-1/2 years in expansionary mode; and (2) M2 money supply would increase by 50% in that time, and yet the Russell 2000 would gain a grand total of just 9% over the same span.
Might VLT Be Out Of Step?
Unless the S&P 500 and NASDAQ correct more than 5% from their March 6th levels by the end of the month, both will trigger new VLT BUYs. Rather than celebrating that prospect, however, we find ourselves wondering what might go wrong.
VLT Update
The progression of bullish technical evidence since October’s S&P 500 low is compelling, though not overwhelming. With that low now almost four months behind us, the VLT Momentum oscillator for the S&P 500 probably “should” have already triggered a new BUY signal. Yet, both the S&P 500 and NASDAQ Composite are still holding out.
1966-67: When The Yield Curve “Failed”
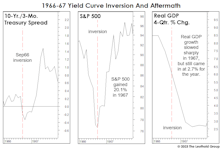
Given the tendency of economists and strategists to dismiss the message of an inverted yield curve, it’s surprising there’s been no scrutiny of the “dog that didn’t bark”—the inversion of 1966. That’s the last time an inverted curve did not lead to a recession.
Is This Year’s Strong Start “Signal Or Noise?”
.jpg?fit=fillmax&w=222&bg=FFFFFF)
This year is off to a much stronger start than suggested by the 3-4% gains in the blue-chip averages: Through January 12th, the Value Line Arithmetic Composite—an equally-weighted index of about 1,700 stocks, was up 7.0%.
VLT: “A Swing” And “A Miss”
We suspected November’s “low-risk” VLT Momentum BUY signal on the Dow Jones Industrials might turn out badly, and we were right: The Dow’s decline last month was enough to cause VLT to roll back over, which officially “rescinds” that signal.
Mixed Messages From VLT

While VLT for the S&P 500 continued to trend lower in November, the DJIA calculation edged higher and triggered a new BUY signal. The message could soon get more confusing: A BUY signal for the Russell 2000 would be triggered if that index closes December above 1,813, while the S&P 500 and NASDAQ would have to climb more than 11% and 15%, respectively, to trigger a VLT BUY.
Don’t Trust The Thrust…

Jay Powell’s speech on November 30th triggered a 1,000-point intraday reversal on the DJIA and left us wondering who might have slipped the Chairman a recent copy of the Green Book.
Jay Powell, The Chartist
.jpg?fit=fillmax&w=222&bg=FFFFFF)
When Jerome Powell took the reins of the Federal Reserve in early 2018, many commentators cheered the fact that he does not possess a Ph.D. in Economics. It will be many, many years before historians are able to conclude whether that’s a good or bad thing.
Yesterday’s action, though, left us wondering whether Powell might stealthily be in the process of earning a different designation—that of Chartered Market Technician (CMT).
VLT: A Double-Sworded Edge

“Oversold” usually has a positive connotation in financial jargon, yet history’s worst air-pockets have almost always occurred when the stock market was deeply oversold. More time is needed before a “low-risk” entry point for the S&P 500 will be triggered from the VLT’s currently “oversold” status.
Supercharging VLT With Small Caps

Leuthold did not invent VLT. The credit goes to Sedge Coppock, a technical analyst who insisted on being called an “econometrician.” While the famed Coppock Curve was based on the Dow Jones Industrial Average, Leuthold found the algorithm useful at the industry group level—it is a component within our Group Selection (GS) Scoring system.
VLT Says Stocks Are Finally Oversold

The 2022 bear market has unfolded in a way that’s finally driven our Very Long Term Momentum algorithm for SPX into oversold territory for the first time since 2016. However, that only means a “low-risk BUY signal” is now mathematically possible—we could be writing about the “impending BUY” for many months to come.
Down—But Not Washed Out

Based on a short-term perspective, stocks may be ripe for a bounce. However, the S&P 500 has not reached “oversold” territory since early 2016, and it is still a long way from doing so. Of the major indexes, only the Russell 2000 is now positioning to soon claim a “low-risk buy” signal.
Down, But Hardly “Oversold”

Historically, a good measure of a fully oversold market has been a drop to negative by our VLT Momentum algorithm. YTD, it has been on the downswing, but is still in the vicinity of its highs reached during the Trump Bump. If the May bottom in the S&P 500 turns out to be the final low for the decline, VLT would be one of many suggesting the new rally is among the riskiest in market history.
Energy: A Curse And A Blessing
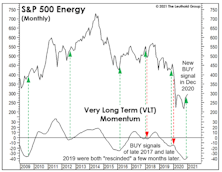
The Energy sector emerged as the top performer for January, a nice respite after a terrible 2020—but not exactly a good omen. Unlike in horse racing—where the concept of “early speed” has significant predictive power—the early leader in the sector-performance sweepstakes hasn’t reliably followed through in the last 30 years.
VLT’s Struggles Are Telling Us Something
Our Very Long Term (VLT) Momentum algorithm has been a very good “confirmatory” market tool over the years, especially at the onset of a new cyclical bull market. But VLT has proven to be of little to no value in navigating this year’s gyrations. VLT’s latest flip-flops reinforce our view that the market leaderboard is set to be rearranged.
Five Reasons To Expect Higher Yields

Much of what we think “we know” about the bond market says yields should be headed higher.
A “Low-Risk” BUY?!?
So what do we make of July’s “low-risk” VLT BUY signal on the DJIA—the index on which the indicator’s creator (Sedge Coppock) did his original work? Sadly, not much.
Perception for the Professional
March 2026 Issue

Featured Articles
Sector Navigator
March 2026 Issue
