Russell 2000
Small Caps: Unresponsive
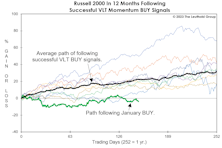
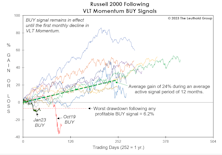
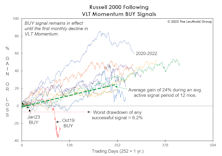
Based on successful Russell 2000 VLT BUY signals, 1982-forward, the index had gained an average of 23% eight months later—and none had a losing position. Since the VLT BUY on January 31st (eight months ago), the Russell 2000 has dropped 3.9%. Furthermore, Small Caps bottomed 15 months ago, and in a normal cyclical bull market, the Russell 2000 would be up 50-70% by this time.
Lowering The Bar!
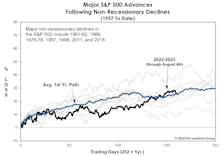
As we’ve noted, none of the major indexes has kept pace with the typical path traced out during past cyclical upswings. It has since occurred to us that this nearly ten-month stock rally is being compared to an unrealistically high standard: The current advance doesn’t have the advantages enjoyed by bulls that launched out of recessionary conditions.
A Look At Where Rate Hikes Are “Working”

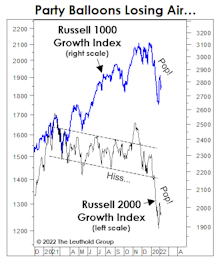
Speculative spirits are back, and the index that’s suddenly close to its 2021 high is the one we viewed as the epicenter of the mania—the NY FANG+® Index!
Small Caps Missed The Memo

For the first time since 1946-47, the super-bullish, six-month window beginning with the mid-term elections through the following April, failed to see a material upswing in Small Caps.
Small Caps Getting Cheaper By The Day
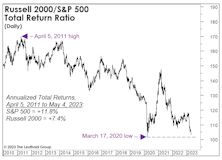
It was September 2020 when we suggested that a new multi-year phase of Small-Cap-stock leadership had begun. Almost immediately, the Russell 2000 reversed a big chunk of the prior decade’s underperformance. Unfortunately, that was the extent of the run.
VLT: You Read It Here Last
We anticipated it for months, and now that it has finally happened, we’re burying the news in the final page of this section. Yes, the last day of March saw the S&P 500 trigger a “low-risk” BUY signal on our Very Long Term (VLT) Momentum algorithm, known elsewhere as the Coppock Curve.
The Cycle That Never Was
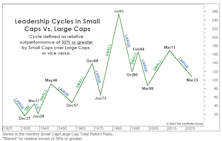
At 144 months, this is now the longest Large-Cap cycle on record, but its dominance will have to prolong to eclipse the second-longest leadership phase (1946-1957), in which Large Caps achieved a 190% performance spread above Small Caps.
Small Caps: We’ve Seen This Setup B-Four
In mid-2020, we wrote that a new multi-year leadership cycle had probably begun. Technically, that belief hasn’t been disproven, but the extent of outperformance has been disappointing in the nearly three years since.
Small Cap Malaise
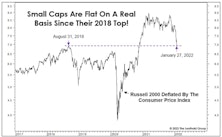
Imagine telling a Small Cap investor in mid-2018 that: (1) the U.S. economy would spend all but two months of the next 4-1/2 years in expansionary mode; and (2) M2 money supply would increase by 50% in that time, and yet the Russell 2000 would gain a grand total of just 9% over the same span.
VLT Update
The progression of bullish technical evidence since October’s S&P 500 low is compelling, though not overwhelming. With that low now almost four months behind us, the VLT Momentum oscillator for the S&P 500 probably “should” have already triggered a new BUY signal. Yet, both the S&P 500 and NASDAQ Composite are still holding out.
Supercharging VLT With Small Caps

Leuthold did not invent VLT. The credit goes to Sedge Coppock, a technical analyst who insisted on being called an “econometrician.” While the famed Coppock Curve was based on the Dow Jones Industrial Average, Leuthold found the algorithm useful at the industry group level—it is a component within our Group Selection (GS) Scoring system.
X-Rays And EKGs
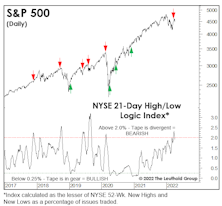
In late March, the S&P 500 rallied to within 3.5% of its January high, likely prompting producers at CNBC to put in an order for “S&P 500 5,000” hats. But we think that 4,000 will be undercut before 5,000 is topped, and action in key indexes (with the notable exception of the S&P 500 itself) reinforces our view.
Two Ways To Spin The Russell 2000 “Bear Market”
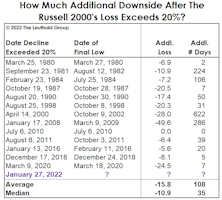
At the market’s January 27th close, the headline blared, “Russell 2000 Enters Bear Market.” Well, not exactly. If one accepts that a 20% decline constitutes a bear market, then the bear actually began on November 9, 2021—the day after the Russell 2000 peak.
“Collared” By The Fed?
In late January, the S&P 500 was down so much (almost 10%!) that it revived talk of investors’ favorite “safe” security. No, not T-bills—and not even Amazon or Apple common stock—but the Fed “put.” Years ago, we called it the “hypothetical” Fed put. But by now, we’re believers.
Small Caps’ Three-Year Ride To Nowhere
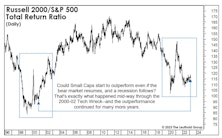
Yesterday, the Russell 2000 closed down 20.9% from its November 8th high, and market bulls have conceded it was “due” for a pullback after a 146% gain off the March-2020 COVID lows.
The Russell’s decline is moderate by the historical high-beta standards of Small Caps. However, this drop—combined with other developments transpiring over the last few years—has produced a shocking result: The Russell 2000 is now unchanged on an inflation-adjusted basis since its “Quantitative-Tightening Top” of August 31, 2018. But what a three-year ride it’s been!
Speculating In “The Nebs”
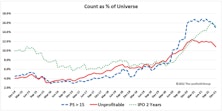
One measure of a bubbly bull market is the degree of speculative fervor embedded in the prices of companies with nebulous, indeterminate, or even nonexistent intrinsic values. Since the bear market low in March 2020, speculative manias have evolved in a menagerie of asset classes including Innovators & Disruptors, SPACs, meme stocks, crypto currencies, and NFTs. Based on the breadth of valuation extremes across numerous and diverse assets, this bull market may rank second to none.
A Squandered Small-Cap Opportunity?

We know our view on this is controversial, but we like the relative prospects for Small Caps—even though we still believe the broad stock market is currently the most speculative one in U.S. history.
A Look At The Small-Cap Setback
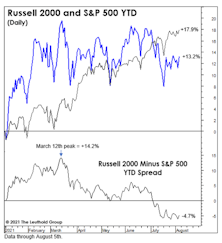
The Russell 2000 has blown the 14% lead it had built against the S&P 500 earlier this year, and now trails the index by almost 5%. Has that type of intra-year reversal happened before, and, if so, did it portend a major change in leadership?
Where Are The Leaders We Need?
Small Caps lagged during the bounce off the March lows before a late-April spurt briefly pulled them ahead of the S&P 500. Still, considering that Russell 2000 losses were so much steeper than the S&P 500’s (-43% versus -33%), we would have expected something better.
Small Cap Smack-Down

We were fooled on Small Caps, and it’s been a “multi-factor” catastrophe.
Perception for the Professional
March 2026 Issue

Featured Articles
Sector Navigator
March 2026 Issue
