Relative Strength
What Does The Dow Have To Say About A “New Bull?”
.jpg?fit=fillmax&w=222&bg=FFFFFF)
Yesterday the NASDAQ 100 closed up more than 20% from its late-December low, prompting the media to enthuse that it had entered a “new bull market!” Sadly, though, the “NDX” has no company among the broad indexes: During this NASDAQ move, gains in the S&P 500 and Russell 2000 have been just 6.5% and 2.9%, respectively, while the DJIA is down 0.5%. (So much for January’s “breadth thrust!”)
Danger For Discretionary?
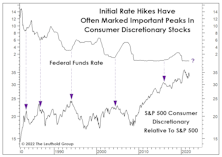
It’s been so long since investors have faced a serious Fed tightening episode that they may have forgotten a helpful rule of thumb: An initial hike in the fed funds rate is usually a good excuse to dump some Consumer Discretionary stocks.
Just A “Small” Beginning...
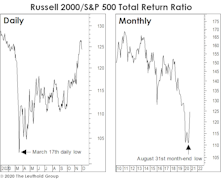
Knee-jerk contrarians are already claiming the stampede in Small Cap stocks is “too consensus” to continue in the near term. We couldn’t disagree more. In fact, we are very confident that a new multi-year Small Cap leadership cycle has kicked off.
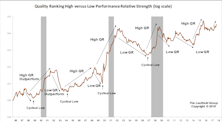
November’s Giant “Low Quality Stock” Rally
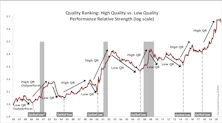
While quant managers watched their factors failing one by one, and market bears stared at the tape in disbelief, the number of retail investors continued to multiply and we witnessed a dramatic performance advantage for low quality stocks. Are we entering a prolonged “junk-rally” cycle?
The “Transportation” Divergence
.jpg?fit=fillmax&w=222&bg=FFFFFF)
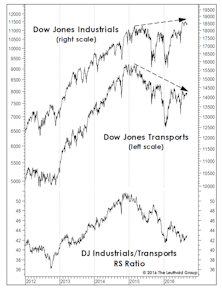
The Dow Jones Transportation Average has recently notched fresh all-time highs. Following a sizable relative performance dip earlier in the year, the Transports’ relative strength has recovered and moved to new 2020 highs (Chart 1). Still, compared to the broad market, the index’s YTD return appears fairly unremarkable, outpacing the S&P 500 by about 3%.
Homebuilders: The Weird And Unexpected
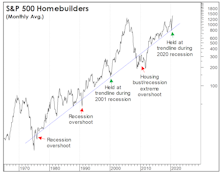
Like many years, 2020 is one in which an investor who was armed with a perfect economic forecast would have been befuddled by stock market action. Who would have imagined that passive equity investors (including many posing as Wall Street strategists) would be so well-rewarded for ignoring the economic downturn?
A “May Day” Revolution?
.jpg?fit=fillmax&w=222&bg=FFFFFF)
With May Day marches and demonstrations cancelled, the workers of the world have one less opportunity to remind us of the ever-widening wealth gap and the evils of the “Top 1%.” It’s a shame, because this was the year that we active managers would have stood shoulder to shoulder with those protesters voicing our own contempt for the “Top 1%”… of the S&P 500.
NASDAQ Goes “Parabolic?”
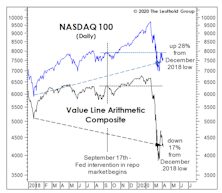
From now ’til eternity, bullish market pundits will always be able to argue that the global spread of the coronavirus “caused” the current global recession and bear market. While the pandemic was certainly the final catalyst, these pages had been detailing the emerging cracks for over a year.
Keep Some Powder Dry
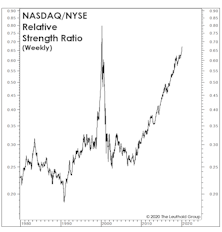
We’ve discussed market analogies with the year 1999 at length, and will give it a rest for awhile—in part because parallels to the year 2000 have cropped up! In the first five weeks of 2020, the NASDAQ 100 has already outperformed the NYSE Composite by about 7%, while in the first five weeks of 2000 the spread was 8%.
How Much Should We Pay For Market Momentum?
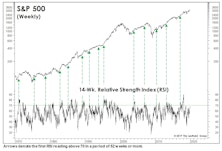
If the S&P 500 closes in the green today, an RSI "overbought" signal will be triggered.
Small Caps And The Recent “Rate Hike”
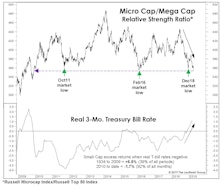
The 1999 leadership parallels we discussed in the latest Green Book remain intact—U.S. over foreign, Growth over Value, and Large over Small. Small Caps have given up most of the “beta bounce” enjoyed in the first two months off the December low, with one Small Cap measure—the Russell Microcap Index (the bottom 1000 of the Russell 2000)—undercutting last year’s relative strength low and those of 2011 and 2016.
Small Cap Biotech Getting Pricey Again
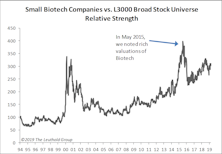
In May 2015, we warned about rich valuations for small cap Biotech stocks and looked at various ways to evaluate those companies, as the majority have no approved drugs on the market, thus no revenue; therefore, valuing these companies using the conventional methodology is problematic.
Rates Are Already Clobbering Consumer Stocks
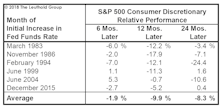
“Three steps and a stumble” was the old rule of thumb for timing the impact of Fed tightening on the stock market.
Consumer Discretionary Holds At #1
This year we’ve written several notes surrounding the Consumer Discretionary sector’s prominence among our top Group Selection (GS) Scores. This pattern persisted for a fifth consecutive month in April.
Leverage Factor: A Boost For High Quality Stocks?
A review of Quality factors, as well as the lower valuations of High Quality stocks, supports the current High Quality cycle amid rising market volatility. The Leverage factor may provide particularly strong backing for High Quality stocks.
Implications Of Extreme Momentum
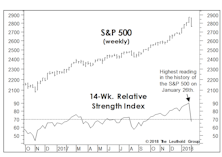
Historically, leadership and breadth accompanying an upside market move is far more predictive than the pure momentum of the move. But when intermediate-term momentum is not just strong but exceptional (as it was until just recently), there has usually been even more upside to follow.
Troubling Transports?
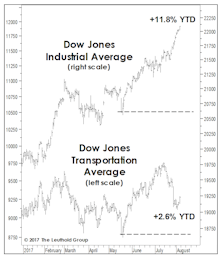
Does the last few weeks’ stumble in the Dow Jones Transportation Average foretell anything sinister? Not on the face of it.
High Beta Breakout?
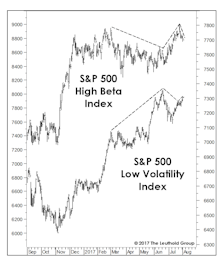
Last month we spent a full page explaining why the underperformance of the S&P 500 High Beta Index was not a bearish portent for stocks (Chart 1).
What Are The Transports Telling Us?
The MTI’s subset of Momentum measures entered September at a 6 1/2-year high reading of +1028, with only two of the category’s 40 inputs in bearish territory.
Divergence Among Quality Factors
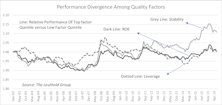
Performance and valuation of the three Quality factors are diverging. From a valuation standpoint, we might see a reversal in performance, with the Stability factor weakening and the Leverage factor strengthening.
Perception for the Professional
March 2026 Issue

Featured Articles
Sector Navigator
March 2026 Issue
