P/E Ratios
Sliced Breadth
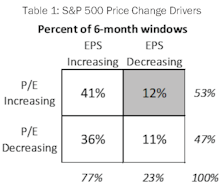
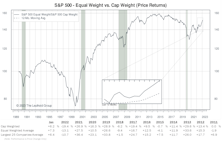
The S&P 500 posted a 7.7% price gain for the six months ended April 30th, although this advance has been a hard-fought battle as gains have resulted from a narrow list of drivers. Style leadership has been concentrated in mega-cap tech names, such that the ten members of the NYSE FANG+® Index have produced 77% of the S&P 500’s YTD gain. Furthermore, gains over recent months have resulted solely from expanding multiples. Narrowness in either thematic leadership or price drivers is concerning because breadth is a useful concept in evaluating the staying power of a market advance. In light of this year’s market action, we are intrigued by the notion of measuring breadth not simply by price moves alone but by examining each of these two important sub-components individually. Does today’s environment, where price gains are driven by valuation increases alone, tell us anything about future market returns?
Research Preview: Market Narrowness In 2023

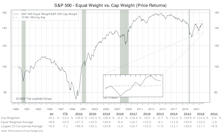
The S&P 500 posted an encouraging +9.2% YTD, but below the surface that strong return was the result of a limited number of influences. There is narrowness in both thematic and return drivers; the fact that gains have not been broad-based is cause for concern about performance during the remainder of 2023.
QE Fuels Inequality—Even Among Stocks
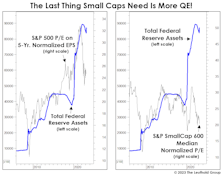
We don’t know enough about banking-system mechanics to conclude if the Fed’s balance-sheet increase associated with March’s bank bailout constitutes a new round of QE. But if it is, we’re skeptical equity investors should celebrate it. In fact, those running Small-Cap portfolios should probably fear it!
George Bailey Goes To Silicon Valley
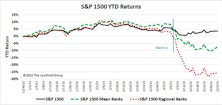
One of the most vivid memories of the Great Depression is the sight of nervous depositors lined up outside a bank hoping to withdraw their meager savings before the bank failed. Like a rare tropical disease that was thought to be eradicated by modern medicine, the classic bank run reappeared this month in the form of Silicon Valley Bank. At the beginning of March, the market had no particular concerns about the potential for systemic bank failures, but SVB’s sudden demise has cast a pall over the entire industry.
Masquerade Party
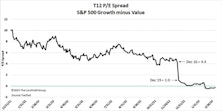
Style investors recently witnessed a rare event when, on February 13th, the P/E ratio of the S&P 500 Growth Index fell below that of the S&P 500 Value Index. At first glance, it is tempting to attribute this valuation flip-flop to the 2022 bear market, which saw Value outperform Growth by a whopping 24.2%. However, the bear-induced collapse of Growth stock prices in 2022 only served to return the P/E spread to a level just below its historical median of 5.1, meaning that the final move toward parity was caused by a force outside the market itself. That “something else” was the S&P 500 style reconstitution that occurs annually on the third Friday of December.
Additional Factors
The S&P 500 had an almost biblical upheaval to start 2023. The “last were first” and the “first were last.” In January, the 100 worst performing stocks of 2022 had an average return of +16.1% while last year’s 100 best performers posted +1.7%.
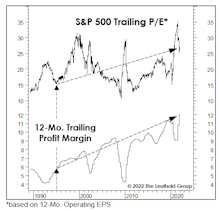
A Valuation Check-Up
The P/E multiple on Trailing Peak GAAP EPS has plunged 44% from its year-ago peak of 32.5x. The current ratio of 18.1x is below its “New Era” median (1995-to-date) —but some conditions characterizing the New Era no longer apply.
Additional Factors
The six-week rally that started mid-June featured advances from AAPL (+25%), AMZN (+30%), and TSLA (+39%), which accounted for one-fourth of the S&P 500’s gain. Despite the recent preference for Value, a spike in interest rates, and the bear market, the index’s concentration in the top-five firms is still near it’s all-time high set in August 2020.
“Recessionary” Valuations?
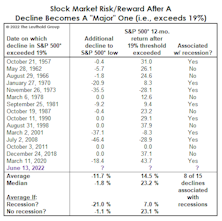
The bear was a mere cub back in March when we examined the historical record of buying S&P 500 dips in the -10% to -12% range. “Blindly” buying them turned out to have mediocre returns, but we illustrated that the positions of various business-cycle indicators could help one determine whether or not catching the proverbial “falling knife” was warranted.
Who Doesn’t Love A Sale?

The S&P 500 closed May 5th with a moderate 13.5% loss from its all-time high, a move that explains only part of what’s already been an historic bear market—in P/E ratios, that is.
New-Era Profits, New-Era P/E Multiples
The current mania won’t last forever. But our use of the “New Era” label in describing the last-quarter century or so of stock-market dynamics is still useful—in part because it highlights fundamental developments that simply cannot be repeated indefinitely.
A Good Year For Cheapskates
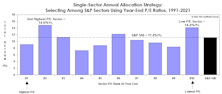
For our more fundamentally-oriented readers who are repulsed by all this talk of momentum, we have an alternative. Just forget about performance and focus solely on value!
Our Annual Lament On Foreign Equities
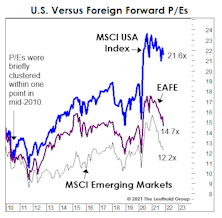
There should be a name for the syndrome suffered by foreign stock investors over the last decade or so. “Groundhog Day” doesn’t quite cut it, because that event repeats only once a year. It seems like this time of year we always feature a chart showing a healthy YTD double-digit gain in the S&P 500, along with a bond-like gain in EAFE, and a bond-like gain or loss in the MSCI Emerging Markets Index.
Big Time
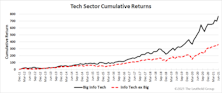
Market environments are driven not just by industry preferences, but also by a bias toward the very largest companies. We have developed a new set of groups composed of the 10 largest companies from each sector. With several of these baskets sporting positive rankings, we felt a closer look was in order.
The “Rule Of Twenty” Revisited
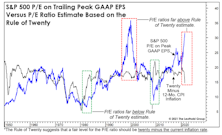
Pundits could reasonably argue the market has never been more expensive in light of the prevailing rate of inflation. That’s the conclusion of the “Rule of Twenty,” which proposes that the stock market’s P/E ratio and the trailing 12-month Consumer Price Inflation rate should sum up to 20.
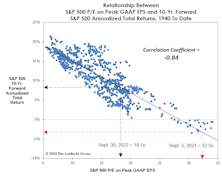
What If The Valuation Message Turns Out To Be Really Wrong?

Today’s Peak P/E ratio implies the S&P 500’s ten-year-forward annualized total return will be in the range of -3%. If this P/E ratio turns out to be as deceptively pessimistic as it was at its worst point in history, the S&P 500 could produce an annualized nominal total return of about +5% over the next decade.
A Closer Look At The “Rule Of Twenty”
.jpg?fit=fillmax&w=222&bg=FFFFFF)
Inflation and its potential impact on the stock market is the topic du jour, resurrecting ideas that were in vogue 30- to 40-years ago.
Steve Leuthold’s 1980 book, The Myths of Inflation and Investing, provided an exhaustive review of the evidence. But for lighter reading, more appropriate for a summer Friday, we revisit the “Rule of Twenty” developed by strategist Jim Moltz in the early 1980s.
Music For The “Mania”
At some point during the June/July streak of seven-consecutive S&P 500 daily-closing highs, an album from 1980 popped into our heads: Nothin’ Matters And What If It Did—released when John Mellencamp was still known as John Cougar. It brought to mind some “nothin’s” that seem not to matter.
Looking Forward To 2021 Earnings
.jpg?fit=fillmax&w=222&bg=FFFFFF)
As we turn the page on 2020, a peek ahead to the S&P 500’s 2021 operating earnings is probably in order. You never know, earnings and valuations might be important again one day.
It’s Demographics, Stupid! (Not The Economy.)
_Page_1.jpg?fit=fillmax&w=222&bg=FFFFFF)
Turn on financial television at any random time, and you’re likely to soon hear the argument that still-high U.S. stock market valuations are “justified” by extremely-low interest rates. We’ve countered that these low U.S. rates are simply a reflection of the secular slowdown in economic and earnings growth.
Perception for the Professional
March 2026 Issue

Featured Articles
Sector Navigator
March 2026 Issue
