Market Tops
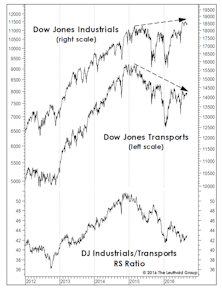
What Are The Transports Telling Us?
The MTI’s subset of Momentum measures entered September at a 6 1/2-year high reading of +1028, with only two of the category’s 40 inputs in bearish territory.
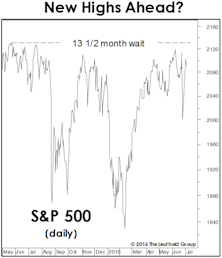
Too Many New Highs To Make A High?
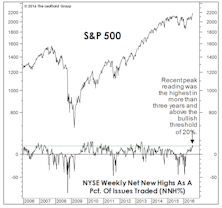
The number of NYSE 52-Week Highs typically peaks during the bull market’s strongest leg, before contracting into the final top. Last month, Net New Highs made a three-year high—implying more upside.
Stock Market Observations
With the S&P 500 levitating near its all-time high, stock market leadership is peculiar—characterized by a flight to quality. And, despite the market’s violent bounce off February lows, there have been only four new market highs set by key indexes on our “Bull Market Top Timeline” table.
“Top In” Or “Topping Out?”
The stock market rally has carried far enough to flip some of our trend-following work bullish, lifting the Major Trend Index to a low-neutral reading. The improvement prompted an increase in asset allocation portfolios’ net equity exposure to 42% (up from 36% previously).
“Transported” To Safety?
Transportation stocks have confounded conventional wisdom about their presumed relationship with oil during the past three years.
All Together Now!
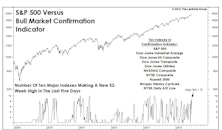
Our Bull Market Confirmation Indicator is tallying a healthy reading. This is intermediate-term bullish, and suggests that a final bull market top should be a minimum of four to six months away.
The Rolling Stock Market Top Of 2013 (… And 2011, 2010, And 2009)
We’ve frequently mentioned the two-faced nature of thematic leadership during the current bull market. Filtering out the minor swings, Phase One lasted from March 2009 through February 2011 and was dominated by low quality, high beta and cyclical stocks.
Perception for the Professional
March 2026 Issue

Featured Articles
Sector Navigator
March 2026 Issue
