Fed Funds
The Return Of Returns
A distinguishing feature of fixed income securities is that the expected return on a bond over its remaining lifetime is known with considerable certainty at the time of purchase. This characteristic can be a blessing or a curse, the negative aspect coming into play during an asset price bubble. Equity investors can justify almost any price as they dream of boundless riches arising from the bubble’s driving theme, limited only by their imagination. However, a bond’s yield to maturity is known at the time of purchase and this is the return investors in aggregate will earn. Even during the euphoria of an asset bubble, the expected outcome - the return of par value at maturity - is also the best-case outcome, and that is where our story begins.
Checking In On The Rally At The Six-Month Point
.jpg?fit=fillmax&w=222&bg=FFFFFF)
Yesterday was the six-month anniversary of the bear market low of 3,577.03 in the S&P 500. We think it’s unlikely the moderate upswing since then represents a new cyclical bull market. However, with the evidence still weighing in at Neutral, we’re not betting the farm on that opinion.
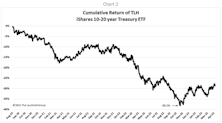
Research Preview: Oh Bond Pain
Here we evaluate the returns of fixed-income ETFs since the Fed began its boosting campaign last March; for many mainstream offerings, the picture is not a pretty one. We recap the pain felt by investors in conventional fixed-rate bond funds.
Inadvertent Easing?
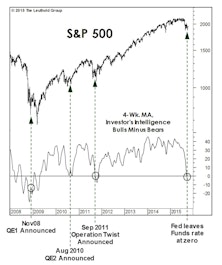
Sometimes, a sharp upside reversal in the stock market will correctly anticipate future improvement in monetary and liquidity conditions. That was the case with the powerful up-leg that sprang from the market’s 2018 Christmas Eve bottom.
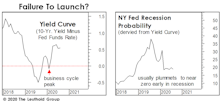
1966-67: When The Yield Curve “Failed”
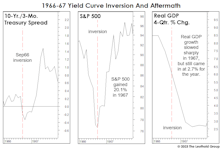
Given the tendency of economists and strategists to dismiss the message of an inverted yield curve, it’s surprising there’s been no scrutiny of the “dog that didn’t bark”—the inversion of 1966. That’s the last time an inverted curve did not lead to a recession.
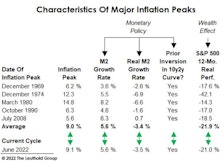
Goodbye Inflation, Hello Recession?
Unlike the five prior cycle peaks, this year’s inflation peak materialized during an ongoing economic expansion. That implies the “post-peak” monetary policy has never been tighter than today—making a soft landing even more improbable.
Fed Funds Rate Above The CPI—Inflection Point Likely
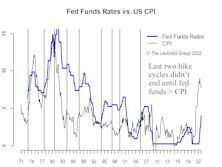
Stock market bulls hope for an end to the tightening cycle in the not so distant future. However, the last two rounds didn’t end until the fed funds rate was raised above the prevailing rate of CPI.
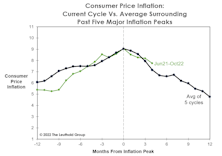
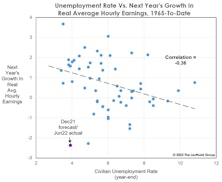
How This Year’s Inflation Peak Differs From Its Predecessors
Our studies of economic and stock market history are meant to provide perspective, not an investment roadmap. But occasionally a current trend will resemble the past so closely it’s eerie.
Take the current inflation cycle. If (as we believe) June’s CPI inflation rate of 9.1% represents the peak for this business cycle, then many of its characteristics have lined up almost perfectly with the “average” of past inflationary episodes.
Past Pivots Prompted By Politics
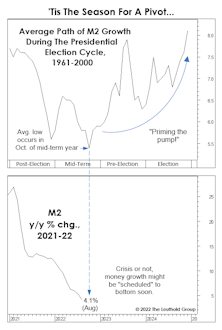
We scrutinized the typical path of money growth during the four-year presidential election cycle, and found that it typically tends to bottom out in October of the midterm year! The cycle says a monetary pivot is imminent, and the average pattern traced out by M2 suggests an acceleration in the growth rate of about 2.5% leading up to the presidential election.
Labor: Snatching Defeat From The Jaws Of Victory
This year it’s been popular to say the Fed will hike interest rates until it “breaks something.” Has that not already happened? Pull up charts of the Japanese yen, the British pound, and the euro, among others. And stateside, the Fed has broken one of economists’ favorite toys: the Phillips Curve.
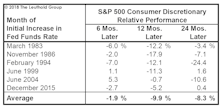
Danger For Discretionary?
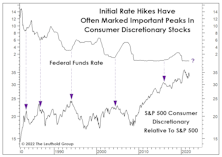
It’s been so long since investors have faced a serious Fed tightening episode that they may have forgotten a helpful rule of thumb: An initial hike in the fed funds rate is usually a good excuse to dump some Consumer Discretionary stocks.
Remember The Yield Curve?
It would be a mistake to ignore (as most pundits will) this important forecasting tool until the next time it threatens to invert. The level and direction of the yield curve provide helpful information throughout the entire economic cycle.
The Alternate Ending?
After last year’s spectacularly successful pivot following the December 2018 plunge, the thinking is that future rate hikes are the bull market’s only threat. Perhaps that will be the case; the belief is certainly well-supported by postwar U.S. economic history, but it also reveals a shocking lapse in short-term memory.
A Confidence Game
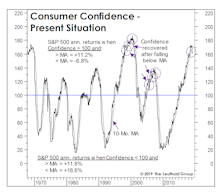
Several consumer confidence gauges plunged in the wake of the Q4 market decline (as expected), and then rebounded in a lagged response to the stock market recovery (again, as expected). But March saw the largest one-month drop in consumers’ assessment of their “Present Situation” since 2008.
Rates Are Already Clobbering Consumer Stocks
“Three steps and a stumble” was the old rule of thumb for timing the impact of Fed tightening on the stock market.
What The Curve Does And Doesn’t Tell Us
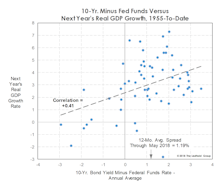
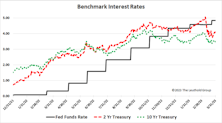
The gap between the 10-year Treasury yield and the federal funds rate has narrowed sharply in the last year but remains a long way (~110 basis points) from inverting.
The Chart The Fed Forgot
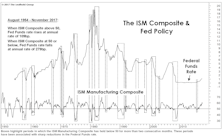
The Fed has long claimed itself to be “data dependent” while providing less and less information on those data points it considers most relevant. We can’t know what’s on that list, but we certainly know what isn’t: the ISM Manufacturing Composite, which (prior to the current cycle) provided an excellent gauge of the Fed’s policy bias.
Discretionary: Is The Top Finally In?
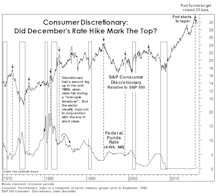
Sector swings have been wild enough thus far in 2016 that Consumer Discretionary’s relative weakness has drawn little commentary.
Sentiment, The Economy & The Fed
We wrote in the January book that 2015 would serve up no shortage of excuses for the Fed to hold off on tightening all year. Whatever window the Fed may have had is now closed.
Data Dependency—September Taper Still Likely
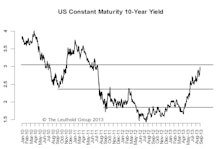
More upside surprises are still likely and, despite the disappointing jobs report, the overall economic picture still supports a September taper. The improving economic picture is not just happening within the U.S., but in other major countries. We still believe the upside for the U.S. 10-year is limited.
Perception for the Professional
March 2026 Issue

Featured Articles
Sector Navigator
March 2026 Issue
