EPS
No Sector On Sale...

While cap-weighted U.S. indexes remain far below their 2000 valuation highs, in some ways today’s market presents an even more difficult hurdle for value managers.
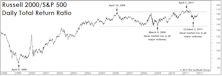
Xenophobia Gone Too Far?

Donald Trump’s all-but-certain Republican nomination is somehow a fitting capstone to a stock market era in which it’s paid to be provincial.
Valuations: The Bad And The Good
Foreign valuations experienced nowhere near the expansion enjoyed by U.S. stocks during the latest bull market, but their cheaper valuations rarely seem to inoculate them from outsized losses during corrections and bear markets.
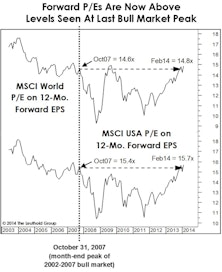
A Kind Word For “Forward Earnings”
Our criticism of the widespread trust in “forward earnings” has sometimes been harsh, but consider the following: the latest 12-month forward EPS estimate for the EAFE index is $122.71, virtually matching the forward estimate that was made in January 2006.

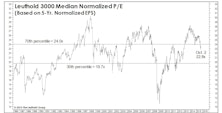
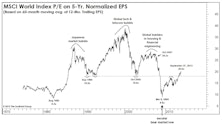
Market Valuation Check
Stocks have long looked expensive on the basis of dividend yield, but now they look increasingly stretched on Forward EPS.
Sector Weightings Adjust To Reflect January Loss Leaders
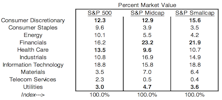
Consumer Discretionary sector weightings sank among all three market tiers, as this segment led the market lower in January. Health Care and Utilities sector weightings increased, as both outperformed for the month.
Dissecting The Capital Tier Indices

Sector weight changes during November were minimal.
Earning Momentum
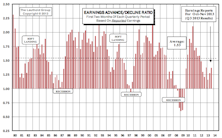
While the current ratio of 1.37 is relatively weak historically, it is still an improvement from the second months’ readings of Q2 (1.27) and Q1 (1.16).
Finding Value In “Forward Earnings”

Forward earnings might be the greatest Wall Street innovation in history: a tool that makes the stock market look cheap all the time.
S&P 500: Equal Weighted Outperforms In Q3; Maintains Lead YTD
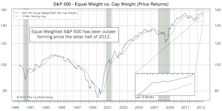
On a YTD basis, the spread between these two indices continues to expand, with the Equal Weighted index now outperforming by more than 4%. Consumer Staples is the most expensive sector among Large and Mid Caps, while Health Care is most expensive in Small Caps.
Earnings Momentum - Q2 Reports Below Average But Ahead Of Q1

With all three months of Q2 earnings reports in, the 1.28 ratio is much stronger than Q1, but remains below the 1.51 historical average ratio.
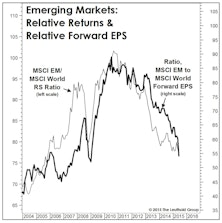
Global Valuations Rising, But U.S. Still At A Premium
The large valuation discount on foreign shares has narrowed a bit, reflecting better relative action in foreign shares over the past 14 months and relatively weaker foreign fundamentals.
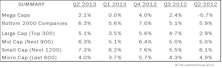
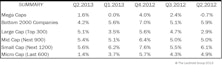
Q2 Median Company Earnings Growth Rates Vary Drastically Across Cap Size
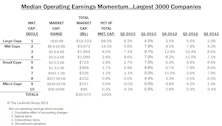
EPS growth for Large and Mid Cap companies continues exceeding their top-line growth, but Small and Micro Cap companies saw their EPS growth rates coming in below their top-line growth rates.
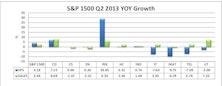
Q2 Median Revenue Comparisons: Higher Growth Across All Segments
Large Cap result this month is the same as last month, but remains stronger than Q1. Smaller firms reversed course, as Mid, Small, and Micro Caps all rebounded with large sales momentum increases.
Dissecting The Capital Tier Indices

Consumer Discretionary’s weight increased the most in the S&P 500, rising 0.5%. Health Care rose the most in Mid Caps (+0.3%), while Information Technology rose the most in Small Caps (+0.7%).
Key Observations On Q2 S&P 1500 Earnings
Year-over-year EPS growth rate for companies with Q2 reports (with about 65% in) currently stands at +4.2%, while revenue growth has come in at a better than expected +2.6%.
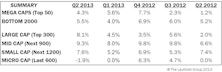
Q2 Median Revenue Comparisons: Higher Growth In Large And Mid Caps
Q2 relative to Q1 growth rates have improved for larger cap companies but deteriorated for the smaller firms.
Predictions for 2012…
From the stock market to politics to football, Doug Ramsey offers up ten predictions and thoughts for the New Year…. Even though we’ve already had a one month “peek” at 2012.
Perception for the Professional
March 2026 Issue

Featured Articles
Sector Navigator
March 2026 Issue
